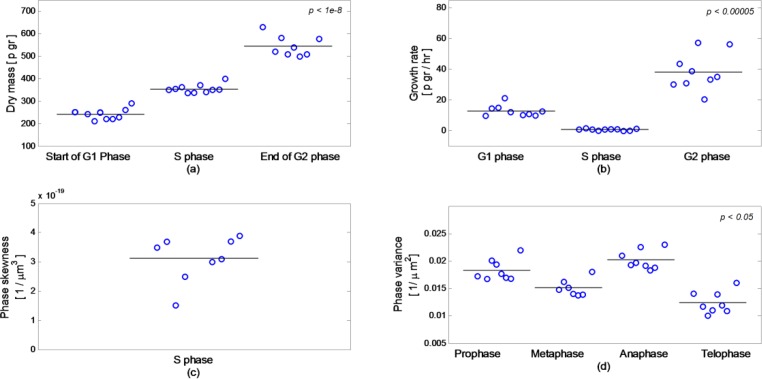
Fig. 12.
Combined measurements on 10 cells: (a) Dry mass; (b) Growth rate;(c) Phase skewness during S phase; (d) Phase variance during M phase. Each circle represents a value for a different cell. Horizontal line represents the average of all values in each group. In some cases, we neglected up to two values due a measurement error or due to a lack of data. All p values are found by Wilcoxon test.

