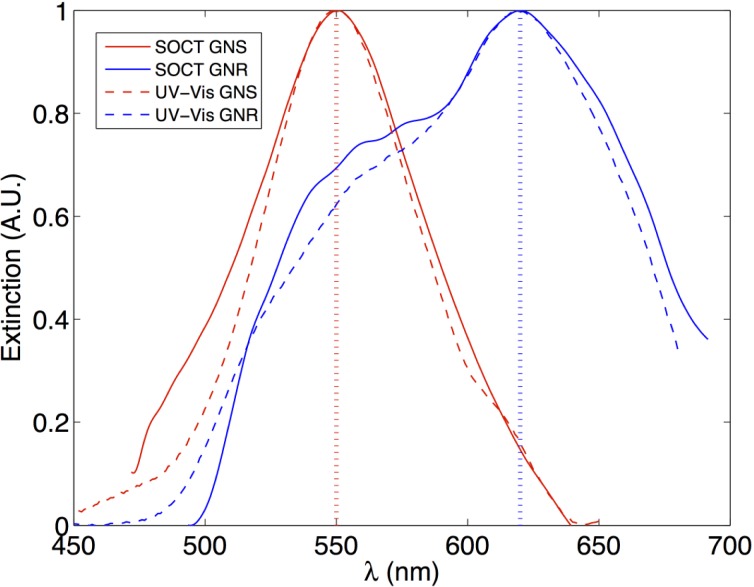
Fig. 2.
Extinction spectra (μ) of the nanospheres and nanorods in DI/glycerol. The solid curve represents the curves obtained with METRiCS OCT (labeled as SOCT) technique, and the dashed curved is obtained from Cary 300 Bio UV-Vis Spectrometer (Agilent Technologies, Santa Clara, US). The GNS shows an extinction peak at 550 nm and the GNR shows an extinction peak at 620 nm in DI/glycerol, both red-shifted compared to the peaks seen in pure DI water. All the curves were normalized for better illustration. Note that the NPs are mostly absorbing, so GNS should appear red and GNR should appear blue when observed in a transmission mode measurement. The discrepancy in the width of the spectra is caused by (1) the lower SNR in the short wavelength and long wavelength portions of the spectra, and (2) the normalization of the signal.

