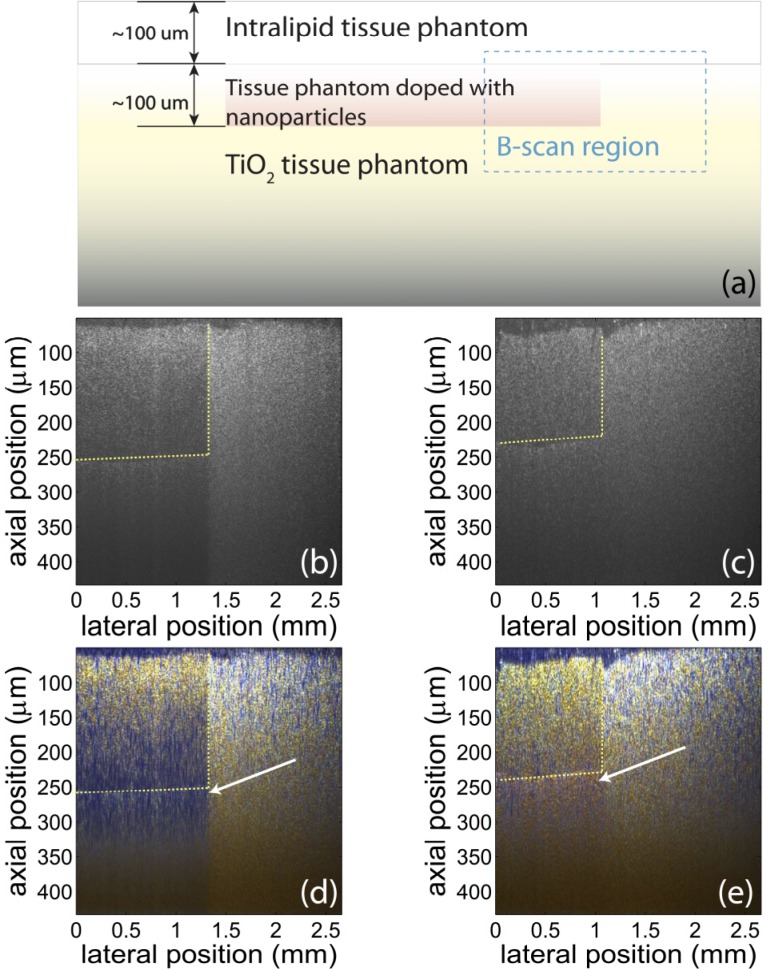
Fig. 4.
(a): Schematic of sample structure. The tissue phantom has three layers: Intralipid/agar layer on top, NP/agar layer in the middle, and TiO2 /agar layer in the bottom. The B-scan is taken in the region in the blue rectangle. (b) and (c): Conventional OCT images of the tissue phantoms with GNR (b) and GNS (c). The regions with different species of nanoparticles are not differentiable in conventional OCT images. Yellow lines indicate the approximate position of the interfaces between regions with and without NPs. (d) and (e) True-color OCT images of the same region as shown in (b) and (c), respectively. The color contrast produced with the nanoparticles can help differentiate the regions with different NPs and the region without any NPs. The blue color (white arrow) is produced by GNR, and the red color (white arrow) is produced by GNS. Note that the concentration of GNR (6.3 nM) is higher than the concentration of GNS (2.3 nM). Also, the absorption of GNR is stronger than GNS. Therefore, color contrast starts to be visible at a lower depth in (d) than in (e).

