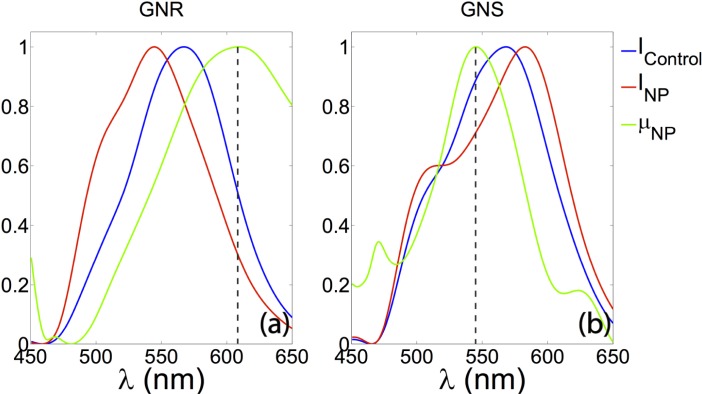
Fig. 5.
Spatially resolved spectroscopic information extracted from the tissue phantom containing different species of NPs. Left: spectra from the sample containing GNR. The peak of the extinction curve (green) has a peak at 609 nm, which is shifted 6 nm from its extinction peak in DI water. Right: spectra from the sample containing GNS. The extinction peak at 545.5 nm which is shifted 10.5 nm shift from its extinction peak in DI water. All the curves are normalized for better illustration.

