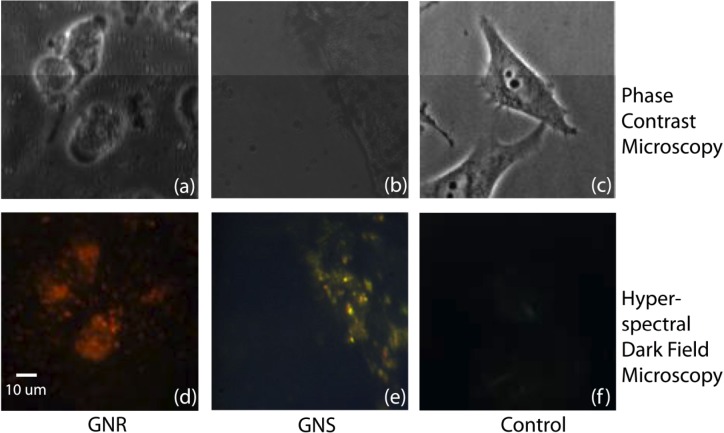
Fig. 6.
Phase contrast images (top) and hyperspectral darkfield images (bottom) of cells incubated with NPs. Left: images of cells incubated with GNR. Middle: images from cells incubated with GNS. The bright spots in (d) and (e) indicate the positions of the nanoparticles and the color indicates the peak of their scattering spectra. Right: images from the cells without GNR or GNS. Note that dark field microscopy detects scattered light, so the color of NPs in these image are different from those in images obtained with METRiCS OCT, which show the absorption of the NPs.

