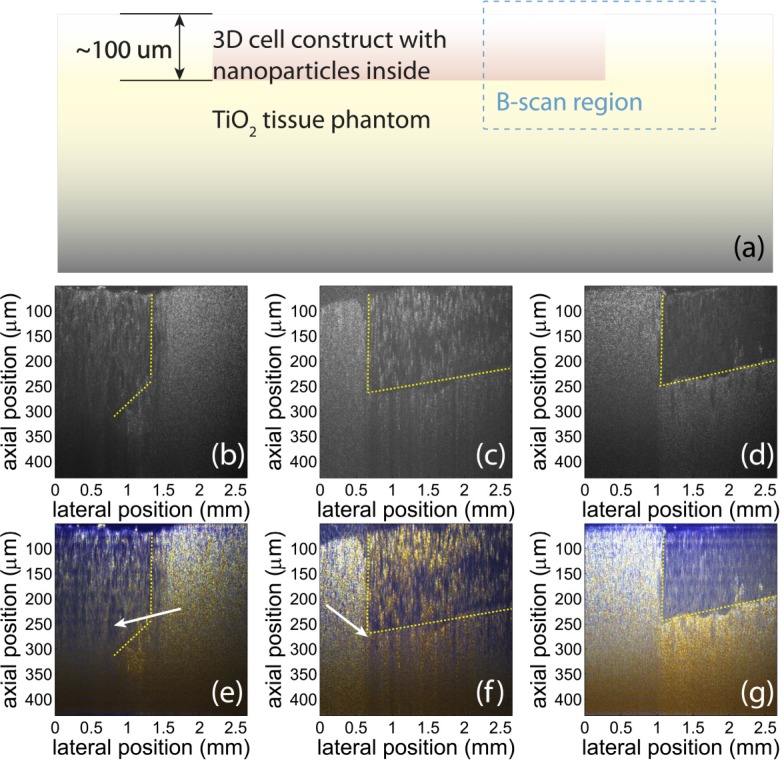
Fig. 7.
(a): Schematic of the three-dimensional cell construct. The cell construct has two parts: cell/agar construct, and TiO2 /agar as control. The B-scan is taken in the interface region indicated by the blue rectangle. (b), (c) and (d): Conventional OCT images of the B-scan. The images are taken from phantoms with GNR (b), GNS (c), and no NPs (d). (e), (f), and (g): True color OCT images of the corresponding B-scans. The color contrast produced with the nanoparticles can help differentiate the regions with cells filled with different species of NPs, as wells as from the cells without any NPs. The blue color is produced by GNR, and the red is produced by GNS.

