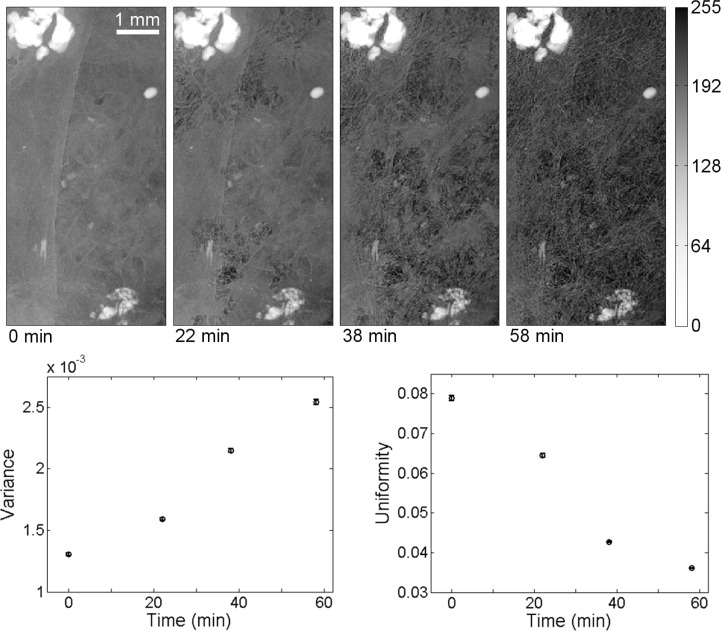
Fig. 2.
The contrast improvement induced by drying is shown here in projection images and plots of image histogram statistics. The cranial defect specimen, which was dried over a period of 58 minutes, shows fibrous polymer layer structures when dried (far right) that are relatively difficult to discern in the un-dried specimen (far left). Quantitative improvements in contrast are shown in the graphs of the time-dependent behavior of intensity histogram variance and uniformity. Note that the specimen occupies the entire frame in these images. The grayscale window is the same for all images.

