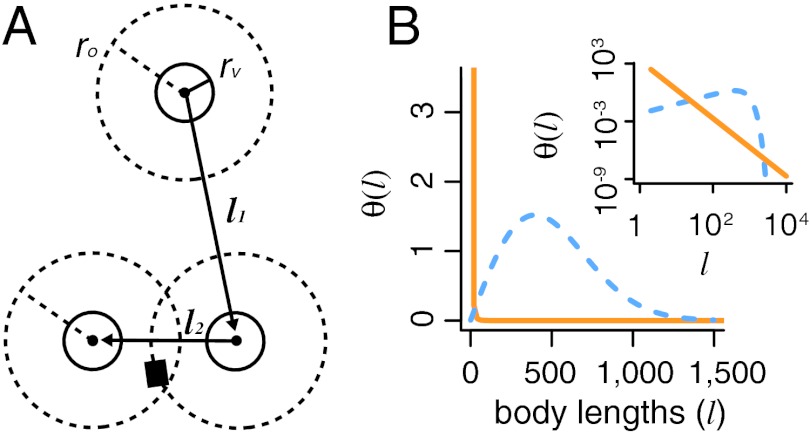
Fig. 1.
Schematic of predator search. (A) During the scanning phase of the search, a prey encounter occurs if the predator is within a radius of rv (solid inner circle) of a prey item (black square). The predator also detects scent signals emitted by prey within a radius of ro (dashed outer circle) at an average rate of ≥1 per τo units of time. The predator then turns a random uniform angle between 0 and 2π. During the movement phase, the predator moves a distance of l units determined by its step length distribution. (B) Step length distributions corresponding to visual Lévy (solid curve, α = 3,lm = 1 body length) and TDD (η = 1/(1,000)2 body lengths, dashed curve) strategies. Inset shows distributions on log-log scale.

