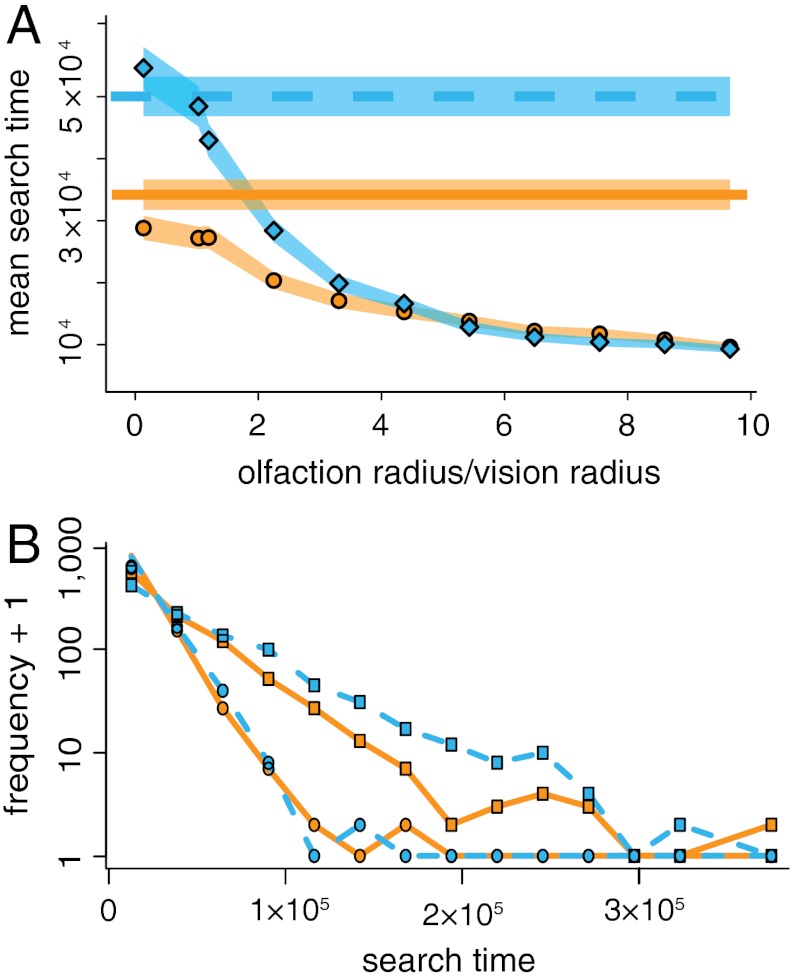
Fig. 2.
Predator search times. (A) Mean search time as a function of the ratio of the olfaction radius (ro) to vision radius (rv). Solid orange line (visual Lévy), dashed blue line (visual TDD), orange circles (visual-olfactory Lévy), and blue diamonds (visual-olfactory TDD) each represent mean search time of 1,000 replicate simulations. Confidence bands represent ± 2 SEM. The following parameters values were used: a = 1, rv = lm = 50a, τv = 1 s, τo = 30 s, mean intertarget distance was 1,000a, and λa = 100 units of scent per τo (see Model Development for description of parameters, also SI Text). (B) Empirical distribution of search times of visual Lévy (orange solid line, squares), visual TDD (blue dashed line, squares), visual-olfactory Lévy (orange solid line, circles), and visual-olfactory TDD (blue dashed line, circles) strategies. In the case of the visual-olfactory strategies, frequencies are shown for ro/rv = 4. Note the large number of searches resulting in long search times for visual predators.

