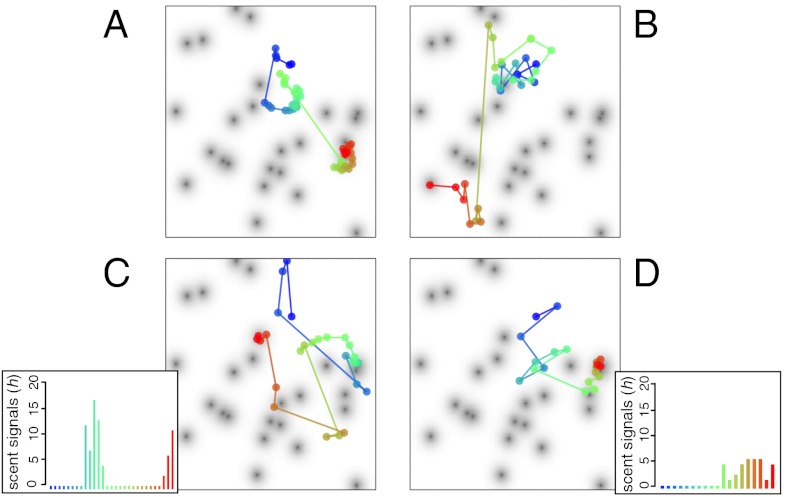
Fig. 3.
Typical search paths through a scent field with log 10(1 + mean number of scent encounters per unit τo) indicated by grayscale (darker gray denotes more encounters). In white regions, mean number of encounters is effectively zero. Paths for (A) visual Lévy, (B) visual TDD, (C) visual-olfactory Lévy, and (D) visual-olfactory TDD are shown. Color scale of path changes from blue to red with increasing time. Inset boxes in (C) and (D) show the number of hits received during each scanning period with colors corresponding to colors in search paths. ro/rv = 4 in all boxes; all other parameters as in Fig. 2A.

