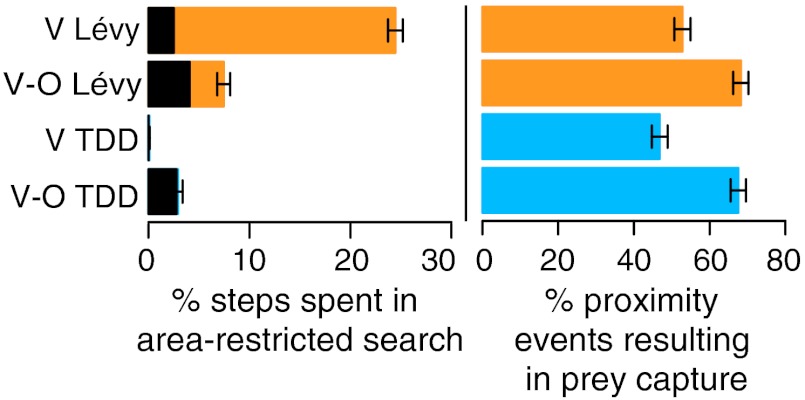
Fig. 5.
Effect of olfactory data on area-restricted search (ARS). Left bars show % steps spent performing ARS. Shaded regions show the % steps spent performing ARS searches within 4rv of prey. For the visual Lévy predator (top bar), contrast the large % of steps spent in ARS, with the small fraction of these steps spent near prey (top bar, shaded region). ARS defined as any period in which predator makes ≥5 consecutive steps within a region of radius 4rv. Right bars show % of proximity events in which predator locates prey. Bars for visual-olfactory (V-O) predators show that they successfully locate nearby prey more frequently than do visual (V) predators. Proximity events defined to by any period of ≥1 consecutive steps within 2rv of a target. ro/rv = 4; all other parameters as in Fig. 2A.

