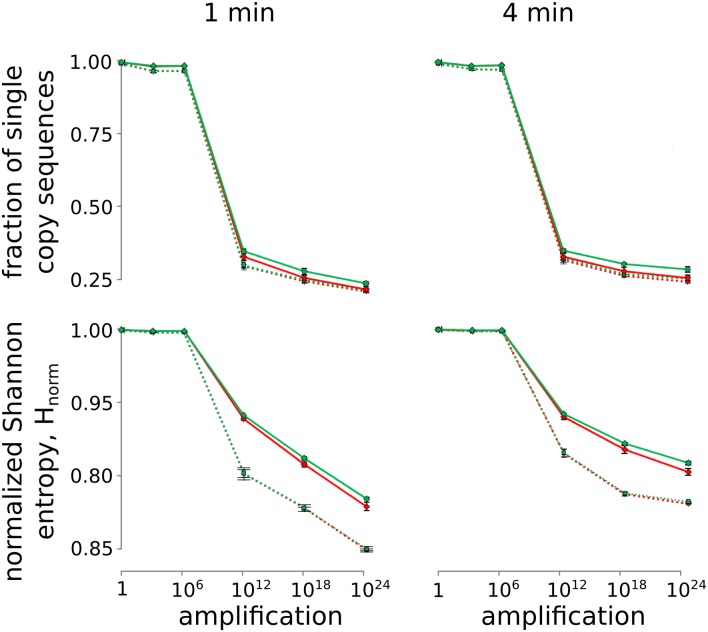
Fig. 3.
Fraction of single-copy sequences (Upper) and normalized Shannon entropy (Lower) for amplification with 1- (Left) or 4-min (Right) extension times. The red lines correspond to the regions proximal to the unnatural base pair, and the green lines correspond to the distal control regions (Fig. 2B). Populations that retained or lost the unnatural base pair are represented with solid or dotted lines, respectively. Error bars were determined from the independent analysis of each of the three sublibraries.

