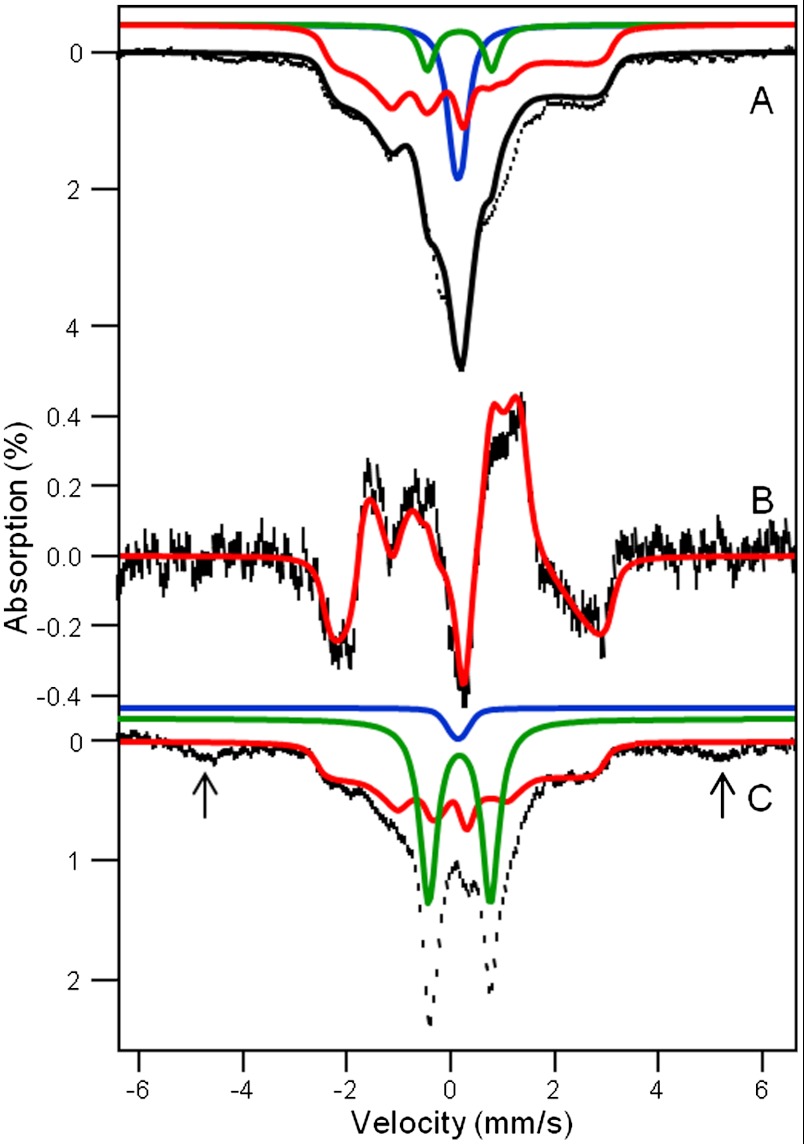
Fig. 3.
A 4.2 K Mössbauer spectra of 2 and 2-H+. Mössbauer spectra of samples containing 2 (A) and 2-H+ (C) recorded in a 50 mT field applied parallel to the observed γ rays. (B) Difference spectrum parallel minus perpendicular, representing 2, obtained with 50 mT applied fields. Red lines are simulations for 2 and 2-H+ based on Eq. 1, using the parameters listed below and in Table 1. The major FeIV═O contaminants are shown by the green (1) and blue (1-OH) lines. The black solid line in A is a spectral simulation for the sum of 2 (55% of Fe), 1 (8%), and 1-OH (16%). The doublets in C represent 27% of 1 and 2% of 1-OH. The arrows in C point to absorption due to a high-spin FeIII contaminant (30%). The δ, ΔEQ, and η values used in the simulations are +0.10(4) mm/s, -0.5 mm/s, and -3, respectively, for 2 and +0.10(4) mm/s, -0.2 mm/s, and -3, respectively, for 2-H+.

