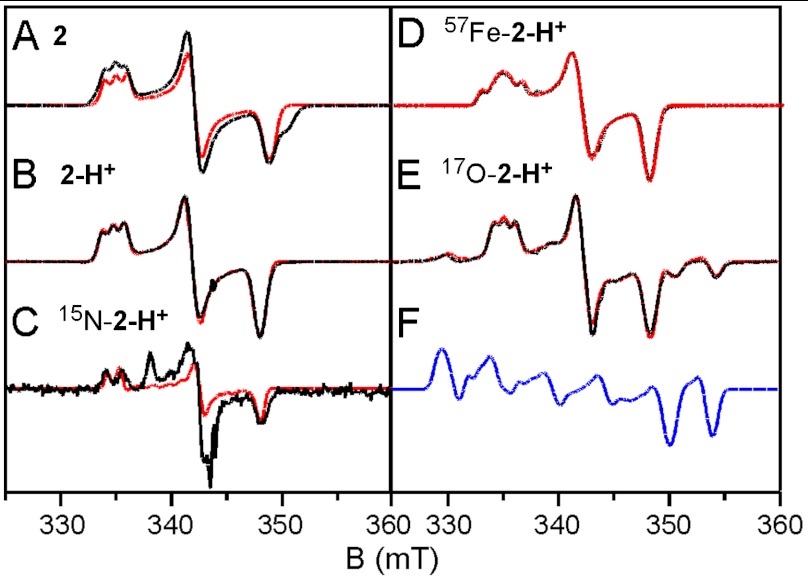
Fig. 4.
X-band EPR spectra of 2 and 2-H+. Experimental data (solid black lines) obtained in 1∶3 CH3CN∶butyronitrile (A, B, D, E) or 1∶3 CH3CN∶ CH2Cl2 (C) and recorded at 40 K. The conditions are, as follows: 9.62 GHz; microwave power, 20 μW; modulation, 0.3 mT. The red lines are theoretical curves generated with the parameters listed in Table 1. The 17O enrichment in E, obtained from EPR, is ≈30%. For 2 only the simulation for the majority species is shown. F shows the spectral simulation of 2-H+ assuming 100% 17O enrichment.

