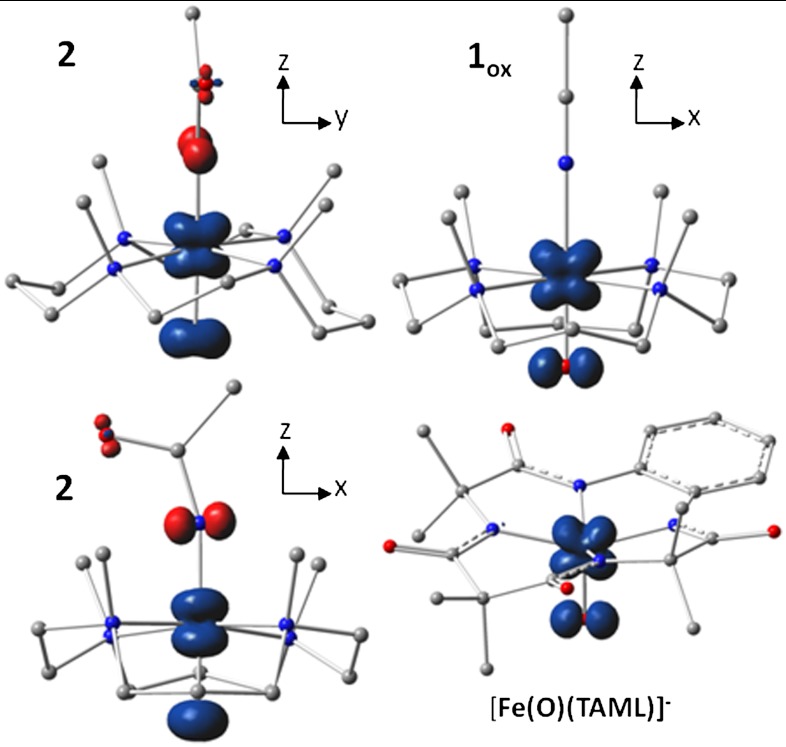
Fig. 5.
Spin density plots of geometry optimized BP86 solutions for  ,
,  , and [Fe(O)(TAML)]-. The plot for
  , shown in two views, reveals the contours of the orbitals carrying spin density. From top to bottom, px (Nam), dyz (Fe), and py (17O). For
  , the TMC ligand has been rotated by approximately 90° around the Fe═O bond relative to the orientation shown for
  . Majority spin α in blue; minority spin β in red.

