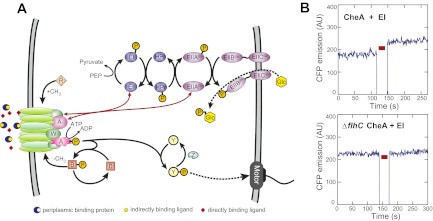
Fig. 1.
Interactions between the PTS and the chemotaxis pathway. (A) Overview of the PTS and the chemotaxis pathway (see text for details). Red arrows indicate interactions between components of both systems detected by an in vivo FRET screen (Fig. S1A). (B) Examples of a positive (Upper) and a negative (Lower) FRET measurement for CFP-CheA/EI-YFP pair in the wild-type and chemotaxis-negative (∆flhC) background, respectively. Red bar indicates a period of acceptor (YFP) photobleaching. AU, arbitrary units of fluorescence. Measurements for other positive FRET pairs and values of apparent FRET efficiency are shown in Fig. S2.

