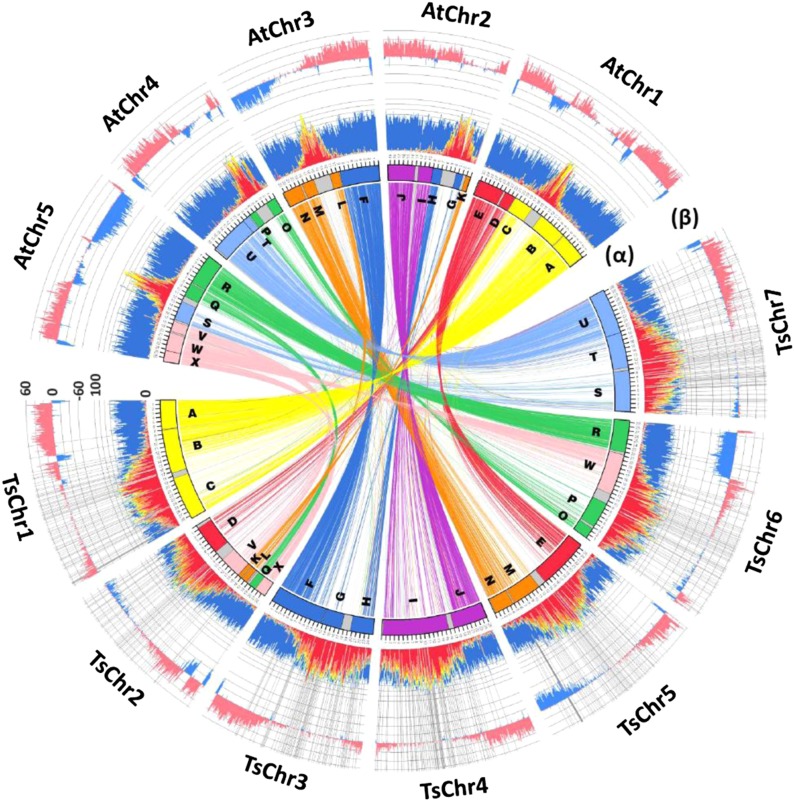
Fig. 1.
The genome of T. salsuginea. The assembled seven chromosomes of T. salsuginea are shown in a comparison with A. thaliana. Ancestral karyotype blocks A–X (10) are shown in different colors. Sequences with >70% similarity over the length of 2 kb are connected by links of the same colors as the ancestral karyotype blocks. Histogram α represents the distribution of TEs and predicted genes. Class I retrotransposons, class II DNA transposons, and unclassified repetitive sequences are indicated by red, orange, and yellow colors, respectively, and the predicted genes are shown in blue. The outer histogram β shows the percentage of sequences that can be aligned between the two species with >70% identity. Alignments longer than 500 bp were counted, and their percentages per 100-Kb windows are presented, with the alignments in opposite directions in the two genomes shown in blue and the alignments in the same direction shown in pink. Scales in the y-axes of the histograms are in percentage. Radial lines indicate the boundaries of the scaffolds used in the T. salsuginea genome assembly.

