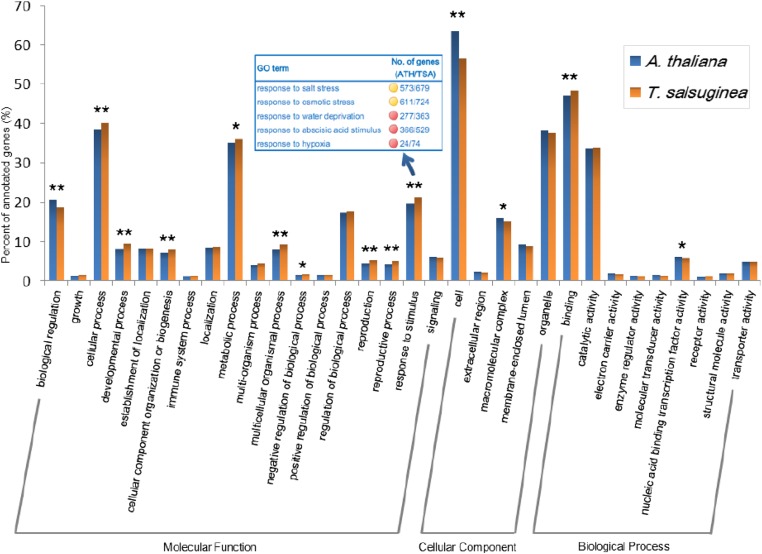
Fig. 4.
GO comparison of T. salsuginea and A. thaliana. Blast2GO results of protein-coding regions from T. salsuginea and A. thaliana were mapped to categories in the second level of GO terms. Fisher’s exact test was used to evaluate the significance of differences in GO category enrichment in the two species. GO terms that contain more than 1% of total genes were included in the graph; those with P values below 0.01 and 0.05 are marked by double stars and stars, respectively, on the histogram. Subcategories of the term “response to stimulus” that differ significantly in the two species are shown in the box.

