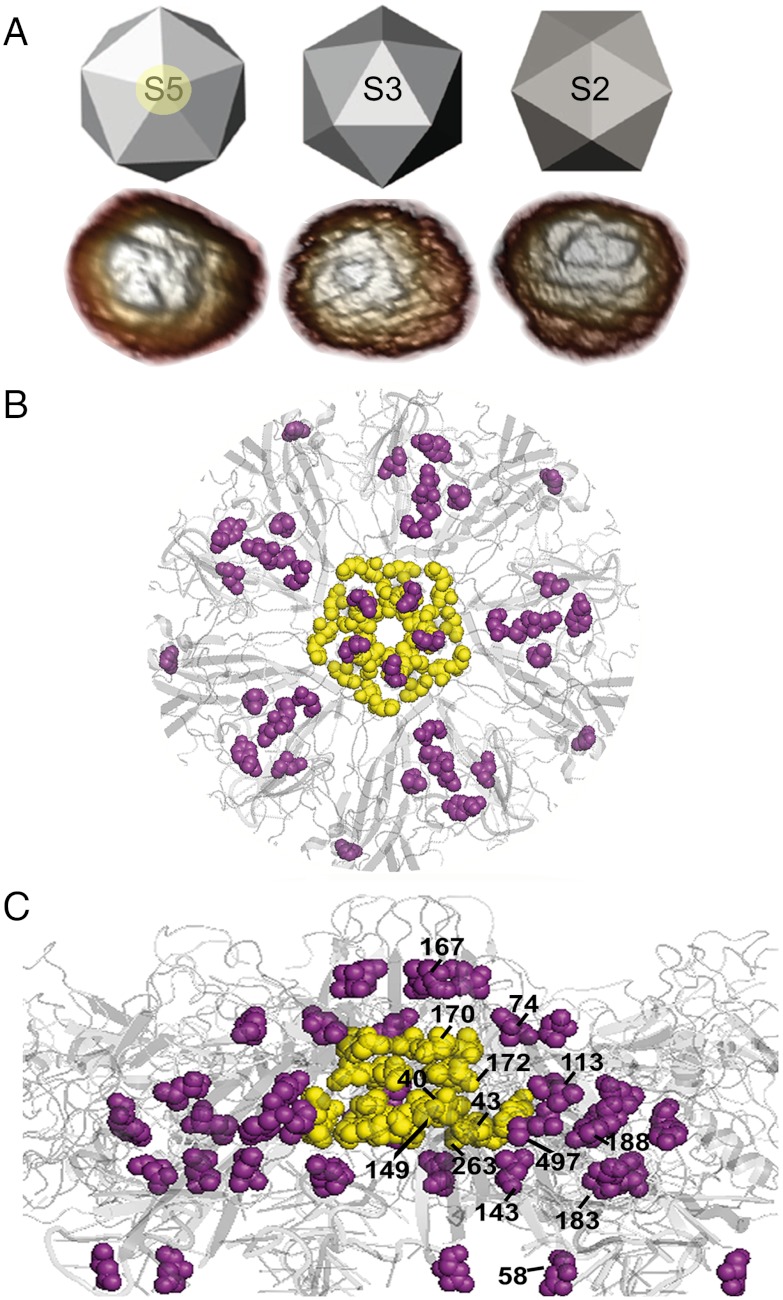
Fig. 1.
MVM capsid structure and mutations tested. (A) Icosahedral model and AFM images of capsids, viewed along a S5, S3, or S2 symmetry axis. The circle around the labelled S5 axis delimits the region represented as a ribbon model of the crystallographic structure in B (front view) and C (lateral view), with a S5 pore at the center. The residues around the base of the pore or other mutated residues are, respectively, represented as yellow or purple spacefilling models and labeled in C. The program PyMol (DeLano Scientific) and the Protein Data Bank coordinates 1Z1C (29) were used.

