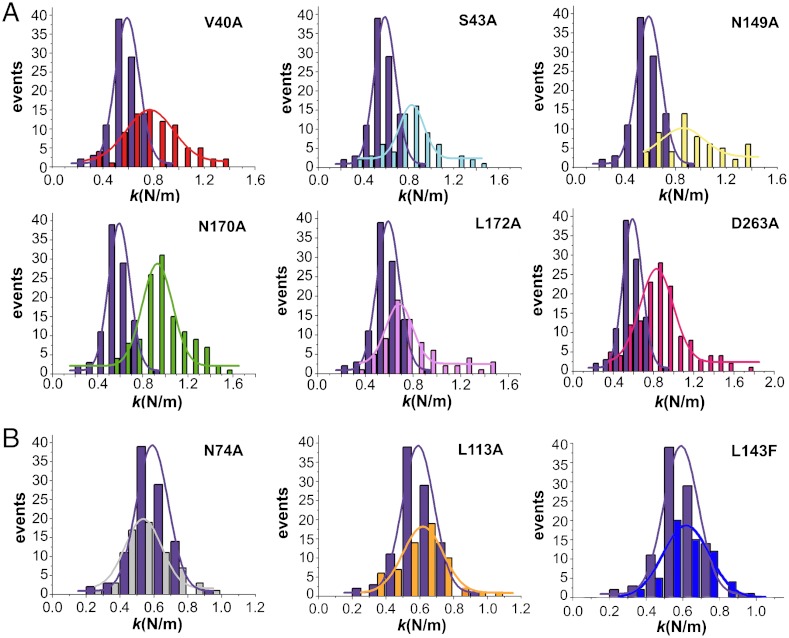
Fig. 3.
Comparison of the mechanical stiffness at the S5 regions between the WT and mutant MVM capsids. Each histogram depicts the number of determinations relative to the ks obtained for a capsid variant. In each graph, the histogram in purple corresponds to the WT capsid, and the one in a different color to a mutant capsid (labeled). (A) Capsids that carry a mutation that impairs both S5 dynamics and virus infectivity relative to the WT (Table 1). (B) Representative examples of capsids that carry a mutation that neither impair S5 dynamics nor virus infectivity relative to the WT. For statistical analysis see Table 1.

