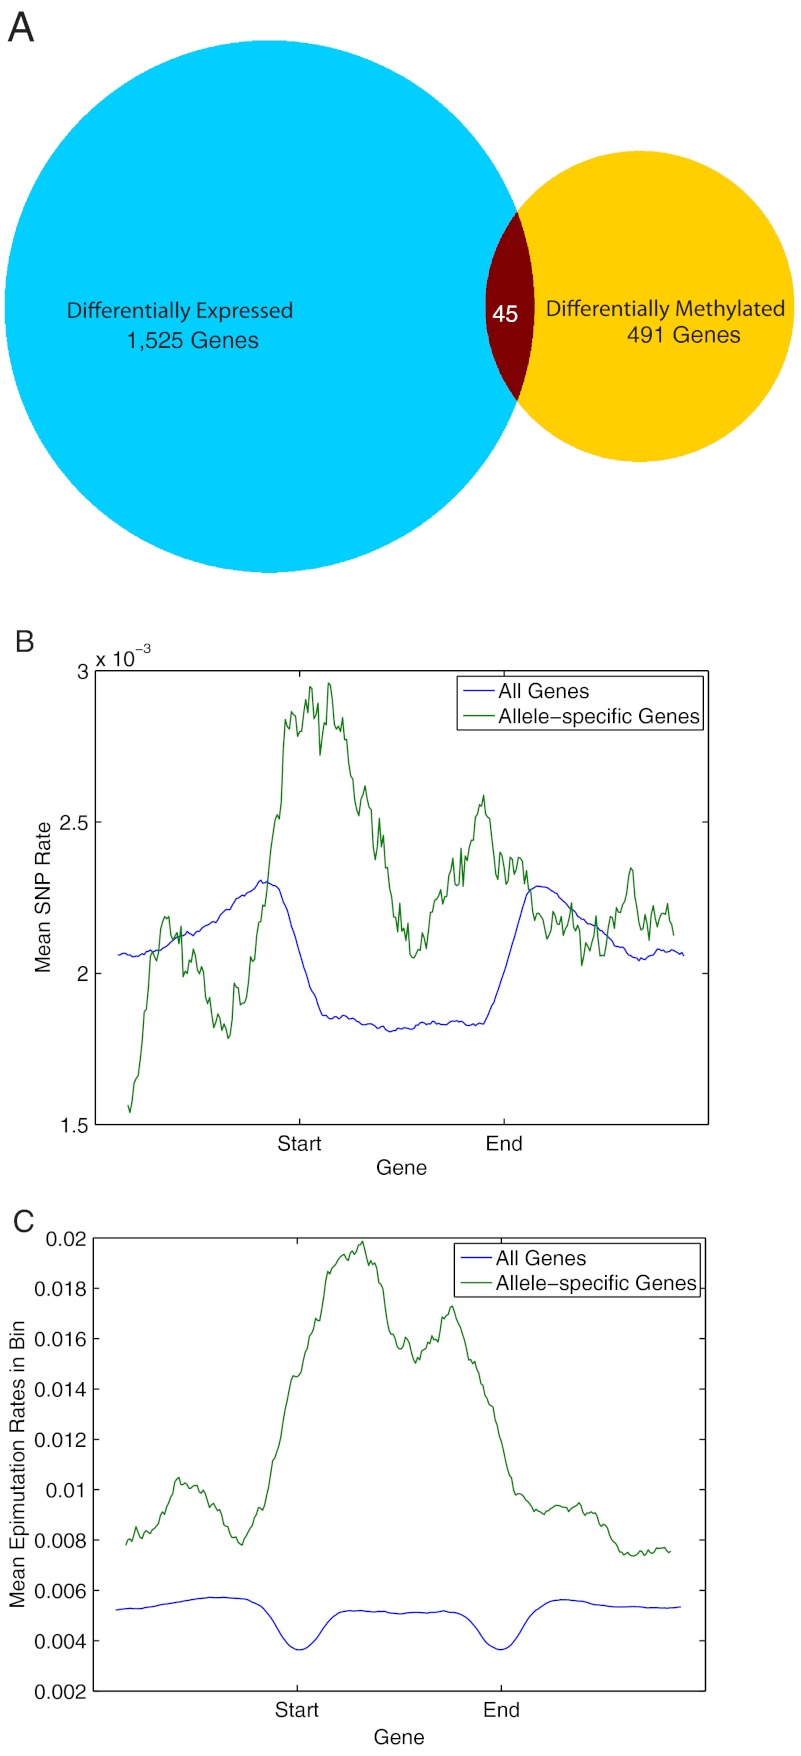
Fig. 3.
Transcript level changes. (A) Venn diagram showing the number of genes differentially methylated or differentially expressed between NPB and 93–11. (B) A metaplot of SNP density is displayed. Each gene was divided into 100 bins and the average SNP density is plotted in 100 bins upstream of the gene to 100 bins downstream of the gene. In allele-specific genes, SNP density increases over the genic region, whereas for all genes, it decreases. (C) Genes are similarly broken into bins as in B, and the epimutation density is plotted over all genes and allele-specific genes. As in the case of SNP density, the epimutation density increases over allele-specific genes compared to all genes.

