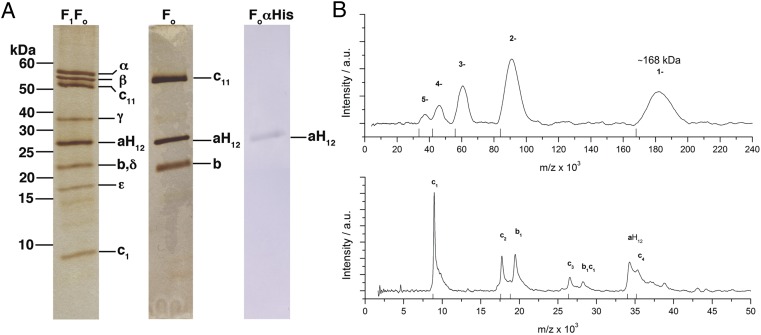
Fig. 1.
Purification and MS analysis of the ITFo. (A) Silver-stained SDS/PAGE (13.1%) with purified ITF1Fo and ITFo. Western blot of purified ITFo against anti–a-His12 (aH12). The molecular masses (kDa) and F1Fo protein subunits are indicated. (B) LILBID-MS of the ITFo. At low laser intensity (Upper), a single charged (1−) peak of ITFo has a mass of 168 kDa. At high laser intensity (Lower), the ITFo was completely dissociated into single subunits (aH12, b1, and c1) and to various ITFo subunit oligomers (c2, c3, c4, and c1b1).

