Fig. 2.
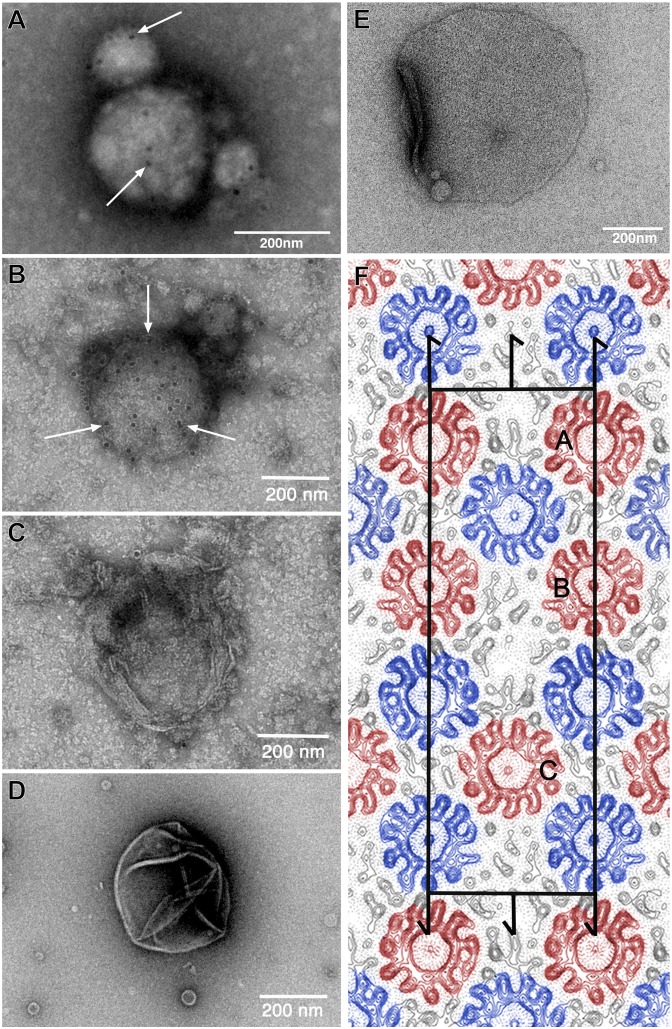
Two-dimensional crystallization and EM analysis of the ITFo. ITFo purified in dodecyl maltoside was reconstituted for 2D crystallization at an LPR of 1.2 and a protein concentration of 1.1 mg/mL. To investigate whether the His-tagged a-subunit is present in the samples, immunogold labeling was performed. Electron micrographs of an immunogold-labeled (anti–a-His12, arrows) vesicle from reconstituted ITFo at pH 8.0 (A) and pH 8.5 (B) are shown. As a dialysis buffer, we used 50 mM Tris⋅HCl (at both pHs), 120–150 mM KCl, 3 mM NaN3, and 1 mM DTT. The samples were dialyzed at 4 °C. As controls, we used empty lipids at pH 8.5 (C) and reconstituted c11 proteoliposomes (D) as done in the study by Pogoryelov et al. (20), which did not show any bound gold label. (E) Electron micrograph of a negatively stained p121 2D crystal from ITFo crystallization setup. (F) Projection map at a resolution of 7.0 Å with symmetry p121 applied. Continuous lines represent density above the mean, and dotted lines represent negative contours. The rectangular unit cell is shown with a = 252 Å and b = 81 Å. Screw axes parallel to the membrane plane are indicated. One unit cell contains two asymmetrical units with three c11 rings in each (marked as A, B, and C); oppositely oriented c11 rings are indicated in red and blue. Densities of Fo stator subunits are visible in the map adjacent to c11 rings (black).

