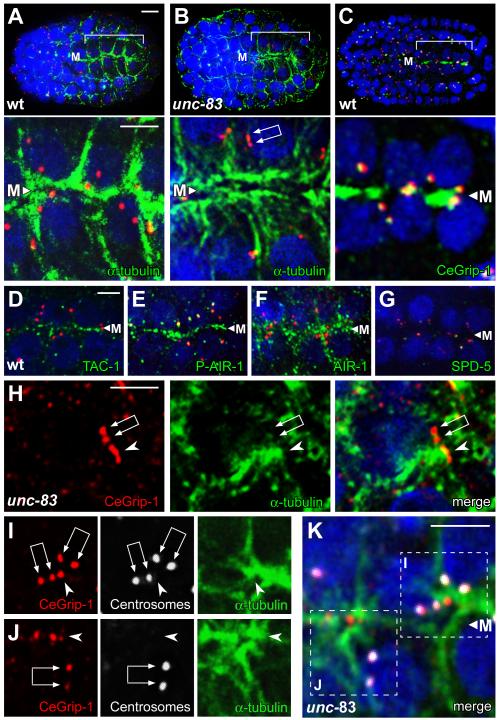
Figure 2.
Generation of the midline/apical MTOC
(A-K) All panels are optical sections through the midline (M) of an E16 primordium, immunostained as indicated; nuclei are stained with DAPI (blue). Centrosome pairs appear as two closely paired dots with variable spacing (double arrows in panels B, H, I, and J), or are unresolved as a larger dot. The upper panels in A-C show low magnification views of the entire embryo with the primordium bracketed, and the lower panels show high magnification views of same E16 cells; centrosomes are stained with IFA1 (red). In the unc-83 mutant (B), note the microtubules extending between the apical membrane and the nucleus. (C-F) The PCM proteins CeGrip-1, TAC-1, and AIR-1 are enriched at the midline/future apical surface. Although the kinase AIR-1 primarily co-localizes with microtubules during this stage, the phosphorylated, active form of AIR-1 is restricted to the apical surface and centrosomes (compare E and F; [30]). Panels H-J show examples of plumes (arrowheads) of CeGrip-1 near the centrosome pair; panels I and J are color separated images of the merged, boxed regions in K. Note the concentration of α-tubulin by the plume of CeGrip-1, and the relative absence of α-tubulin by the centrosome pair. Scale bar = 5μm (A-C), 2.5μm (D-K and insets in A-C). See also Figure S2, Figure S3, and Movie S2.

