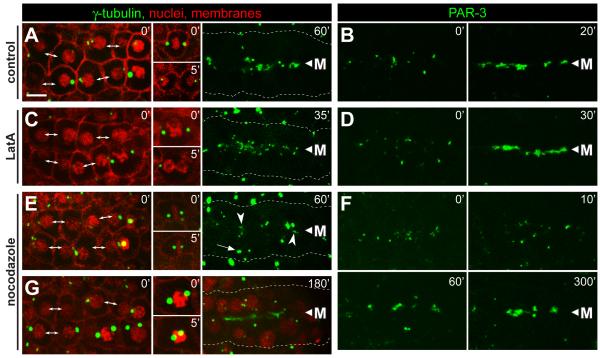
Figure 5.
Inhibition of microfilaments and microtubules during epithelial polarization.
Each column shows examples of live, E16 primordia from wild-type embryos expressing the reporters indicated at top; the reporters used are as in Figure 1. Embryos were either mock treated (control), or exposed to latrunculin (LatA, 10μM) or nocodazole (10μg/mL) as indicated. The left panels for each column show the primordium immediately after exposure to the inhibitor. At the stage selected for γ-tubulin analysis, the primordium includes newly separated sister cells (double-headed arrows), as well as some cells that have not finished the E8 to E16 division; these latter cells arrest division (A,E,G) or fail cytokinesis (C) after treatment with inhibitor (inset panels). In the stage selected for PAR-3 analysis, PAR-3 foci were visible on the lateral membranes of E16 cells (left panels, t=0). (A-D) In control embryos and LatA-treated embryos, centrosomes, γ-tubulin and PAR-3 show robust apical localization before 60 minutes (see also timed sequence in Figure 4H). In LatA-treated cells that failed cytokinesis, γ-tubulin did not localize to the apical surface within the same time period (data not shown). (E-G) Embryos treated with nocodazole show only irregular apical localization by 60 minutes, but much better localization of γ-tubulin and PAR-3 by 180 minutes and 200 minutes, respectively. Centrosomes (E, 60′ arrow, G) and nuclei (G) fail to move apically following nocodazole treatment. Note the spreading of PAR-3 foci away from the midline 10 minutes after nocodazole treatment, suggesting that these foci normally traffic toward the midline on microtubules. Scale bar = 5μm. See also Movie S6.

