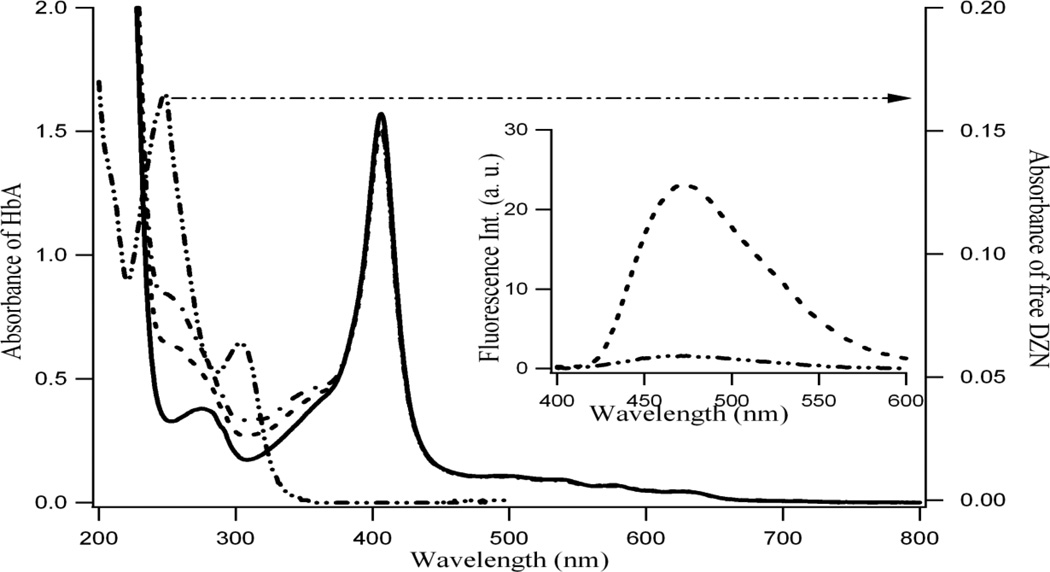
Figure 1.
Typical absorption spectra of hemoglobin (1 × 10⁻⁵M, solid line, free) and with 6 × 10⁻⁶ M (- - -); 1.5 × 10⁻⁵ M (-.-.) of diadzein (see left axis). Right axis presents the absorption of 1 × 10⁻⁵ M free diadzein in aqueous phase (-..-..). Inset: Fluorescence spectra of 1.0 × 10⁻⁵ M diadzein in aqueous phase (-..-..) and protein matrix (-----). λex=340 nm.

