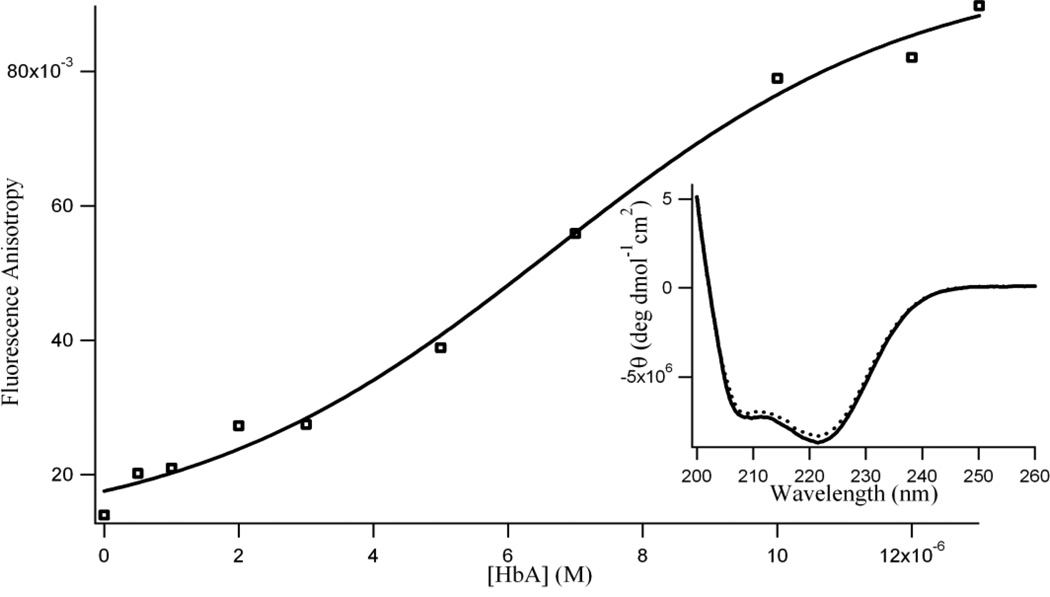
Figure 4.
Variation in fluorescence anisotropy (r) of diadzein (1.0 × 10⁻⁵ M) with increasing protein (HbA) concentration (λex = 340 nm; λem = 470 nm, excitation and emission bandwidths were 5 nm). Each data point indicates the average of three determinations. Inset: Circular dichroism spectra of 3.0 × 10⁻⁶ M hemoglobin (HbA) in absence (solid line) and presence of 10.0 × 10⁻⁶ M diadzein (dotted line) in 0.01 M phosphate buffer, pH 7.4.

