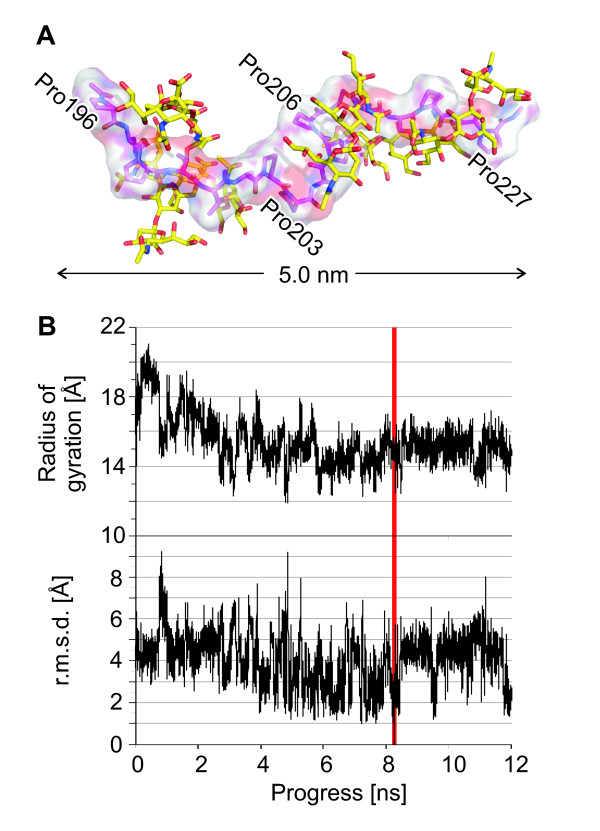
Figure 7.
Molecular modeling. (A) The structure of the lowest energy obtained by molecular dynamics simulation is shown as a stick model and a van der Waals surface with pink carbon atoms. Glycans are shown with yellow carbon atoms. Prolines 203 and 206 have α-helical conformations. (B) Radius of gyration values during the simulation and r.m.s. deviations of the backbone atoms from the structure of lowest energy (marked in red). The peptide's lowest-energy structure had a radius of gyration of 14.6 Å, compared to 17.9 Å for the initial structure.

