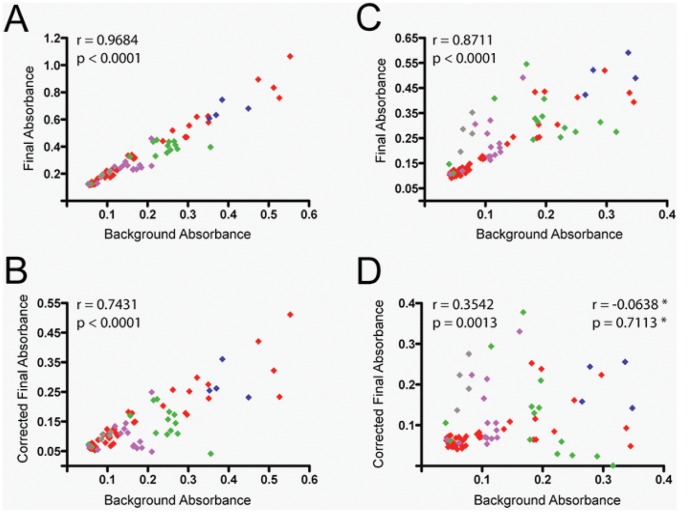
Figure 1. Correlation between background and final absorbance results (raw or corrected by background subtraction) in dilutions of SIV-infected and -uninfected macaque plasma samples tested for LPS content.
Shown are bivariate analyses of background absorbance values and final absorbance (A and C) or corrected final absorbance (final absorbance minus background; B and D) read at their respective wavelengths: (A and B) final absorbance values were measured at 405 nm in the absence of the diazo-coupling modification or (C and D) at 540 nm after performing the diazo-coupling modification. Dilutions are color-coded (20% plasma concentration in red, 2% in blue, 1% in green, 0.5% in purple, 0.2% in gray). *Correlation and significance values marked with asterisks were calculated after removing all points representing 20% plasma (in red). Spearman’s correlation was used for all analyses.

