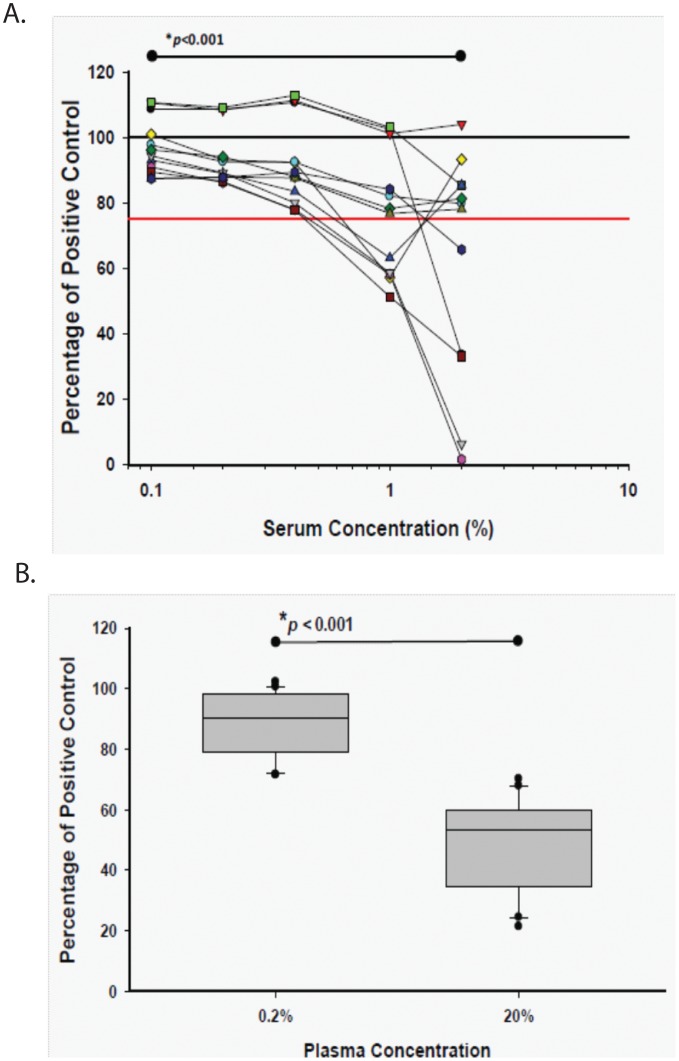
Figure 3. LPS masking in HIV-infected persons.
A) Exogenous LPS of a fixed concentration from a reference E. coli standard was added to samples from 12 HIV-infected subjects that were diluted from 20% to 0.1% concentration. Levels of no inhibition (black line) and 25% inhibition (red line) are indicated. B) LPS was measured in each of 20 samples from from 10 HIV-HCV co-infected subjects and compared to a known quantity of LPS in assay diluent. The amount of inhibition was quantified for each specimen as a percent of the exogenously added LPS (100% indicates no assay inhibition) and compared in aggregate between the same samples in 0.2% plasma and 20% plasma. *Mean percent inhibition was compared between the indicated concentrations using the paired t-test.

