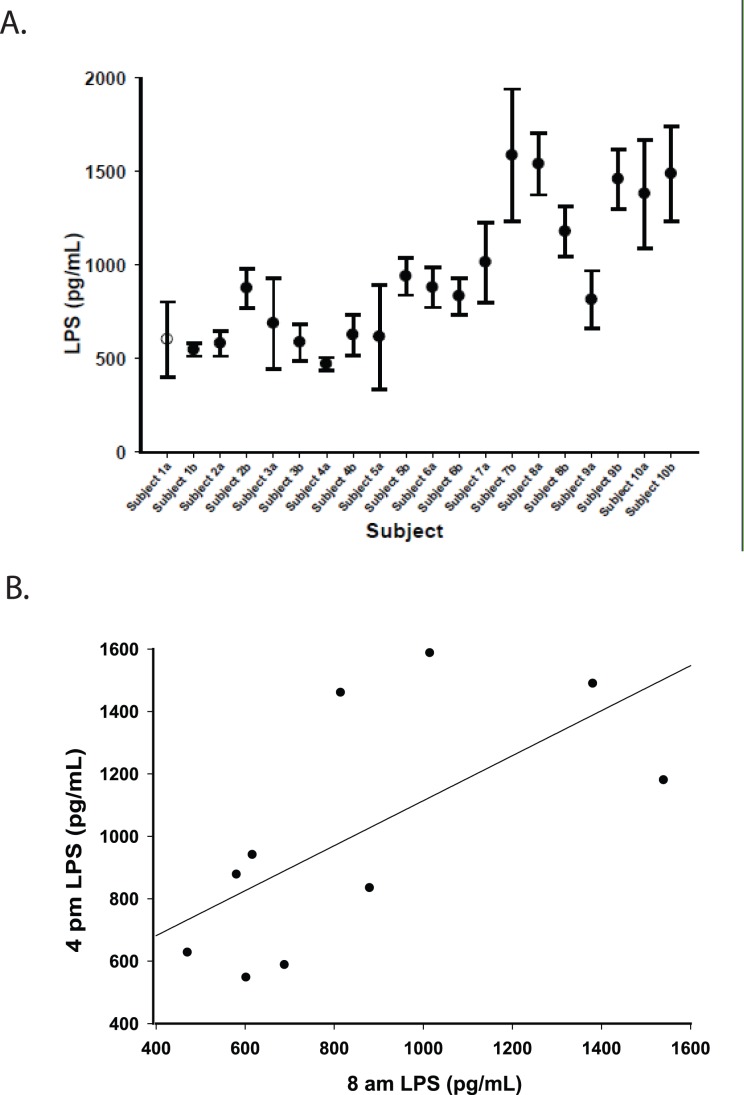
Figure 4. LPS measurements in 0.2% plasma are precise. A.
) LPS was measured in triplicate (specimens 1–9) and duplicate (specimens 9, 10) in naïve samples diluted to 0.2% plasma from persons with HIV-HCV co-infection. Samples were obtained in the morning and afternoon for each subject and compared. Shown are mean ± SD for each subject at both time points, indicated by a subject number followed by “a” or “b” to denote the first and second time points, respectively. The SD for each sample ranged from 34 pg/mL to 354 pg/mL, and did not significantly differ between samples tested in triplicate compared to samples tested in duplicate. B) LPS was measured in samples from the same subject drawn at different times and correlated. Pearson R = 0.66, p<0.05.

