
Figure 4. Effects of diabetes duration on the association between changes in dose and HbA1c stratified by HbA1c levels.
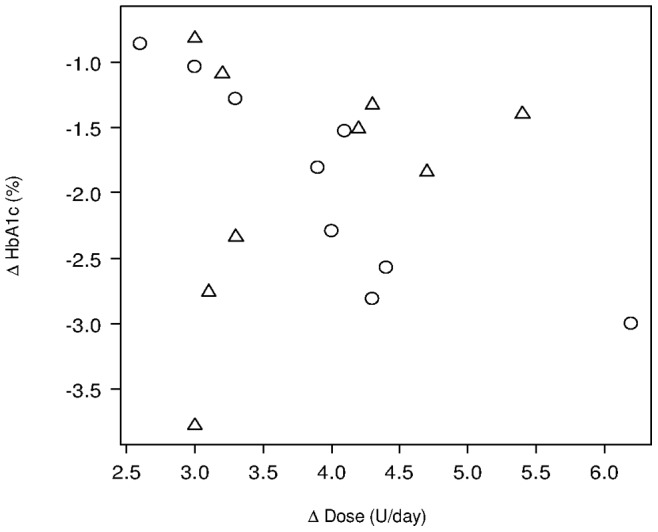
Circles represent patients with a long duration of diabetes (≥5 years) and triangles means those with a short duration (<5 years). The long duration group showed a linear correlation, while there was no relationship in the short duration group.