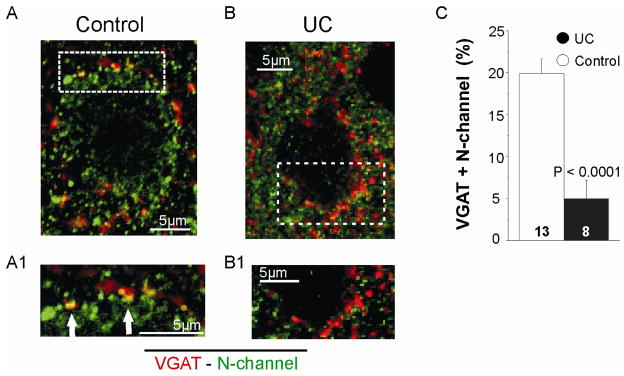
Figure 4. Decreased perisomatic density of N-type channels in UC inhibitory terminals.
A. Image of confocal section through center of a control layer V Pyr cell. Dual immunoreactivity for VGAT (red) and N-channel (green) is colocalized (yellow) in control inhibitory presynaptic terminals. A1. Image of boxed area in A at higher magnification and increased contrast shows co-localized pixels in control perisomatic region more clearly (arrows).
B. Confocal image showing lack of perisomatic colocalization of VGAT- and N-channel-IR in perisomatic terminals of an UC Pyr cell. B1. Confocal image of boxed area in B at higher magnification and increased contrast.
C. Mean percentage of perisomatic colocalization of VGAT and N-channel-IR for 13 control and 8 UC Pyr cells in layer V. Here and in Figs. 5, 6, results are expressed as total immunoreactivity area/area of perisomatic region of interest and normalized (see Methods)

