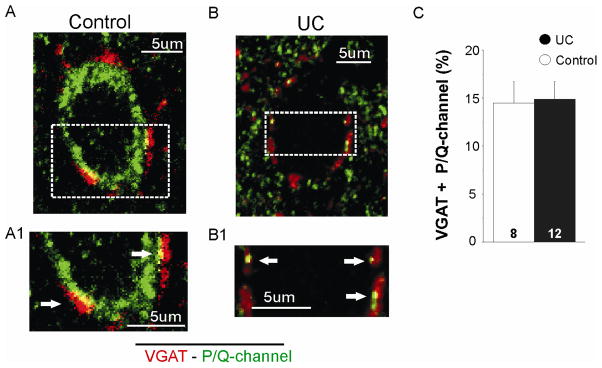
Figure 5. Perisomatic density of P/Q-type channels in inhibitory terminals from control and UCs.
A. Perisomatic colocalization (yellow) of VGAT- (red) and P/Q-channel-IR (green) present in control inhibitory presynaptic terminals. A1. Boxed area of A shown at higher magnification to better visualize co-localized pixels in control perisomatic region (arrows).
B. Representative image from UC cell showing perisomatic colocalization of VGAT- and P/Q-channel-IR (yellow) similar to that of A. B1. Boxed area of B at higher magnification to visualize co-localized pixels in control perisomatic region (arrows).
C. Means for perisomatic co-localized IR for VGAT + P/Q-channels are similar in control and UCs (unpaired t-test; P > 0.05).

