Figure 2.

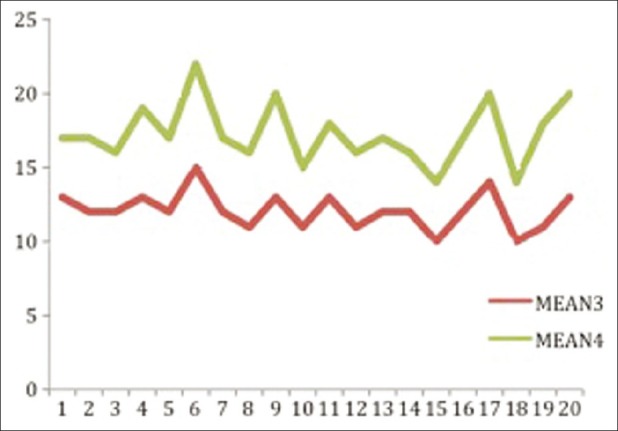
Comparison of Mean Airway Pressures during PCV(mean3) and PCIRV(mean4) X axis- no. of patients, Y axis- airway pressures in cm of H2O

Comparison of Mean Airway Pressures during PCV(mean3) and PCIRV(mean4) X axis- no. of patients, Y axis- airway pressures in cm of H2O