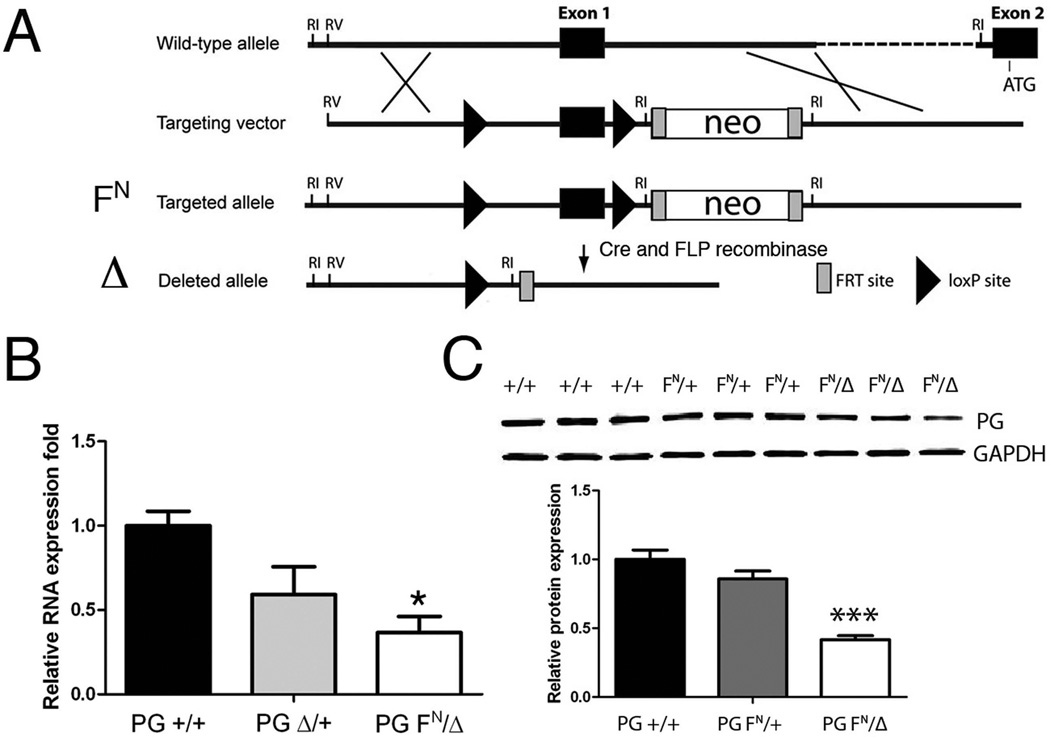
Figure 1. Generation of PG hypomorph mouse model.
(A) Schematic representation of the expected gene replacement at the PG locus. loxP sites are represented by triangles. The rectangles represent FRT sites. The combination of PG floxed allele (FN) containing a neomycin cassette (neo) with the germline null allele (Δ) resulted in a PG hypomorph (PG FN/Δ). (B) Quantification of PG mRNA expression in PG +/+, PG Δ/+, and PG FN/Δ hearts (n=4 for each genotype) at 3 months of age. (C) Representative Western blot of heart lysates from 1 month old PG +/+, PG FN/+ and PG FN/Δ mice (n=6 for each genotype) were immunoblotted for PG and GAPDH. *, p<0.05; ***, p<0.001.

