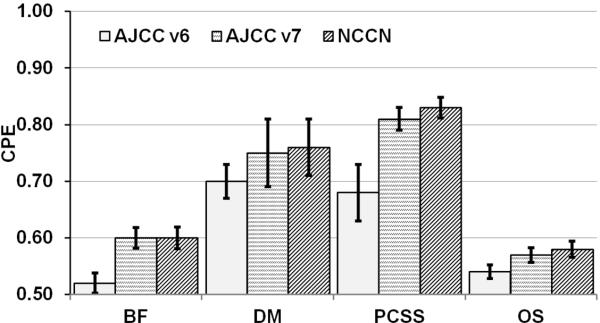
Figure 4.
The concordance probability estimates (CPEs) and their respective standard errors (SEs) in assessing the ability of the AJCC v6, v7, and NCCN risk groups to predict biochemical failure, distant metastasis, prostate cancer specific survival, and overall survival. Both treatment (RT versus RT+ADT) and RT dose (< 75.6 Gy versus ≥ 75.6 Gy) effects were included in the model as covariates. The closer the CPE is to 0.5, the lower the predictive accuracy of the model; the closer the CPE is to 1, the better the predictive accuracy. The results show uniform improvement in the predictive power of AJCC v7 and NCCN compared to that of AJCC v6 for all endpoints, in particular for DM and PCSS.

