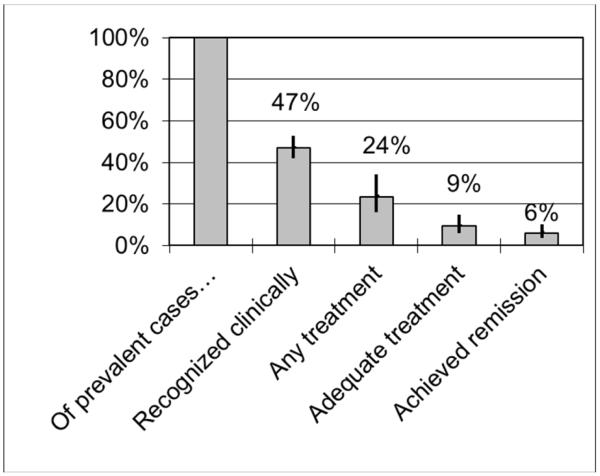
Figure 3. The Depression Treatment Cascade.
The figure depicts, of all primary care patients with a major depressive episode in the past year, the estimated proportion recognized clinically, receiving any treatment, receiving adequate treatment, and achieving remission. The bars represent point estimates and the vertical lines indicate 95% Bayesian credible intervals (Figure 4).[24]

