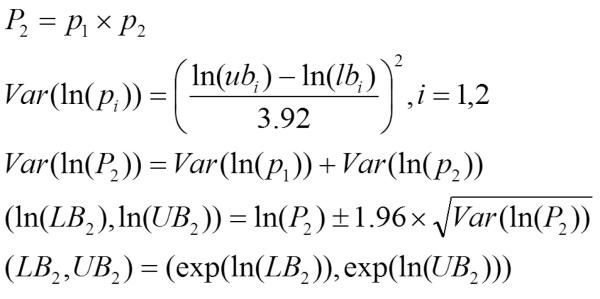
Figure 4. Calculation of 95% Bayesian Credible Intervals for estimates in the depression treatment cascade.
To place cumulative 95% Bayesian credible intervals (BCI)[24] around the cascade estimates shown in Figure 3, we transformed each individual estimate (p1–p4) and BCI onto the log scale, calculated the implied variance of each transformed estimate from its transformed BCI, calculated the variance of each cumulative estimate on the log scale as the sum of the variances for each component individual transformed estimate, used this variance to calculate a 95% BCI on the log scale of the cumulative estimate, and exponentiated the result to translate the BCI back onto the original percentage scale. For example, in the formulas above, let p1 be the proportion of those with a depressive disorder that are recognized clinically, and p2 be the proportion of those recognized clinically receiving any treatment (Figure 2). Let (lb1, ub1) and (lb2, ub2) be the 95% BCIs around p1 and p2 respectively. Finally, let P2 = the proportion of those with a depressive disorder receiving any treatment, and (LB2, UB2) be its 95% BCI.

