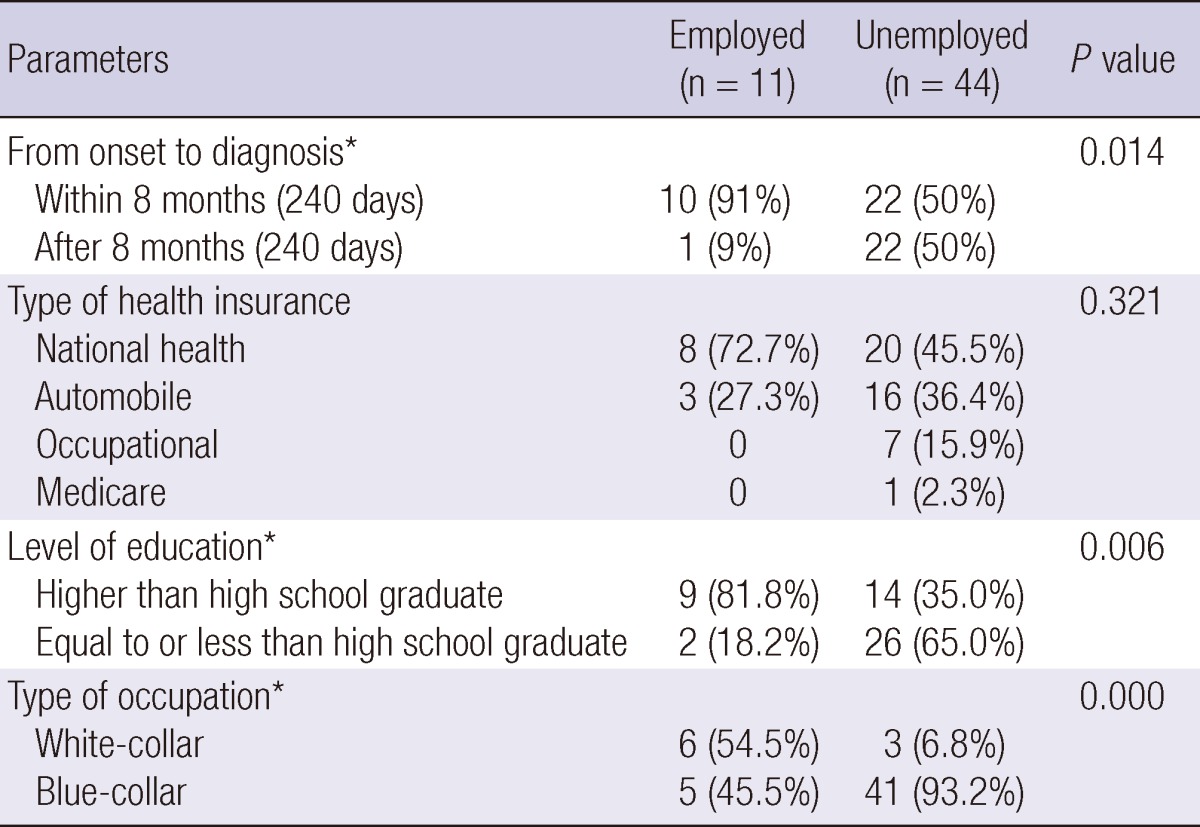
Table 3.
Duration of diagnosis, insurance, level of education, occupational characteristics of CRPS patients

Data are expressed as number of cases and percentage. A percentage is a ratio of a number to each group (employed and unemployed). From onset to diagnosis, the days from onset of symptom to diagnosis of CRPS. *P < 0.05.
