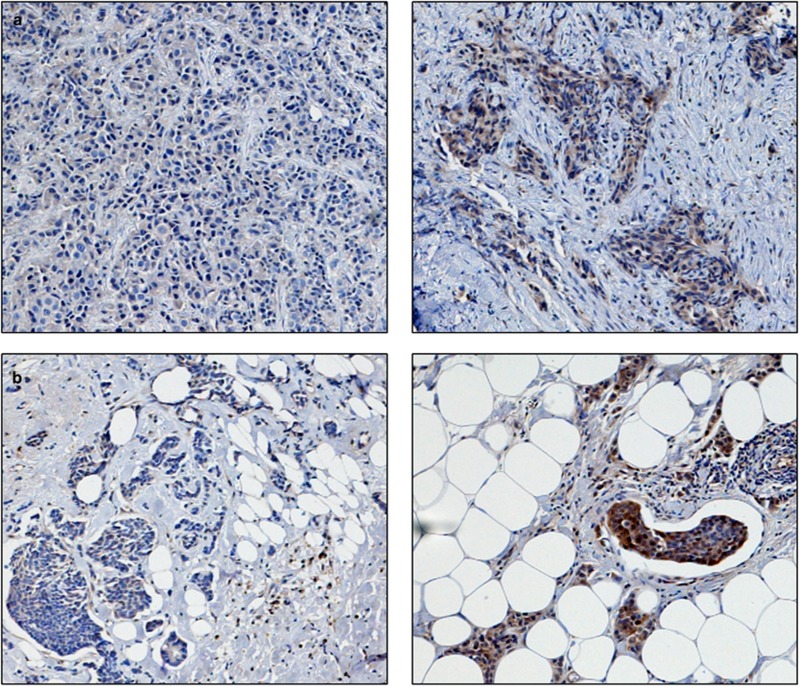
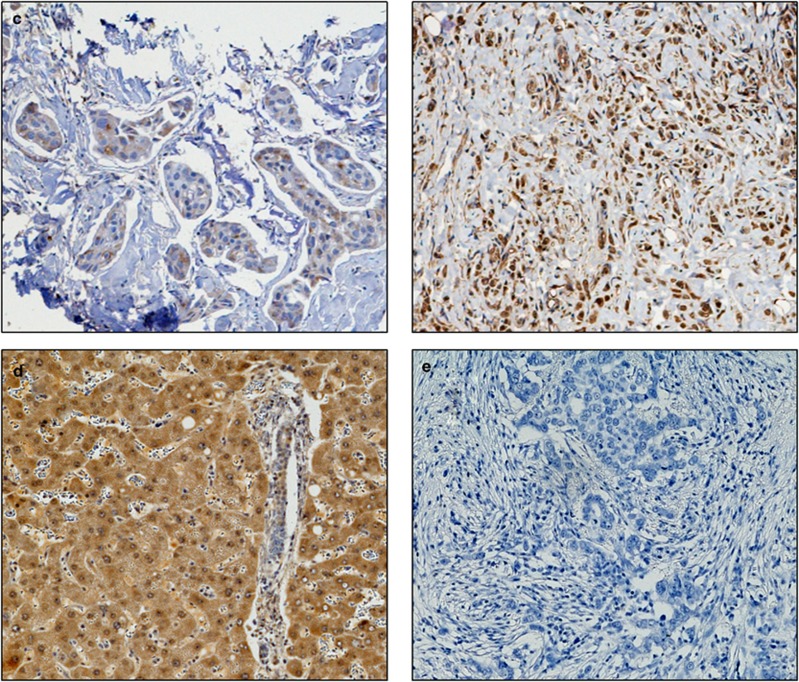
Figure 2.
Photomicrographs of low (left panel) and high (right panel) immunohistochemical protein expression at × 10 magnification (a) glutathione S-transferase θ (b) glutathione S-transferase π (c) catalase. Positive control showing glutathione S-transferase α staining on liver sections (d) and (e) breast composite demonstrating absence of staining. Stain is 3,3′-diaminobenzidine counterstained with haematoxylin.


