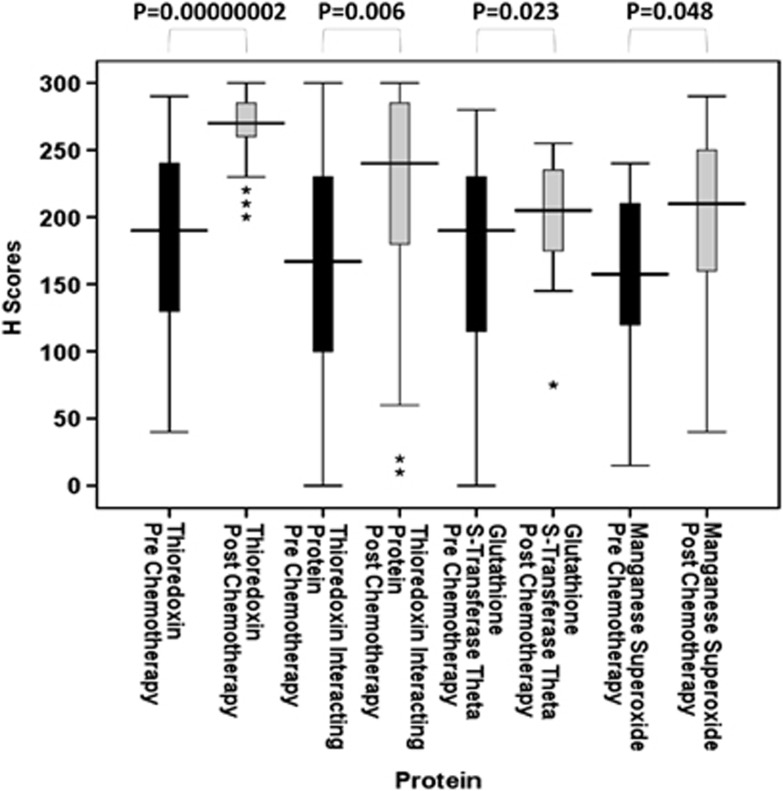
Figure 5.
Stem and leaf plots of thioredoxin, thioredoxin interacting protein, glutathione S-transferase θ and manganese superoxide dismutase protein expression pre- and post-anthracycline-based chemotherapy. Figure demonstrates that significant increases in protein expression have occurred after chemotherapy treatment. *P<0.05; **P<0.01; ***P<0.001.

