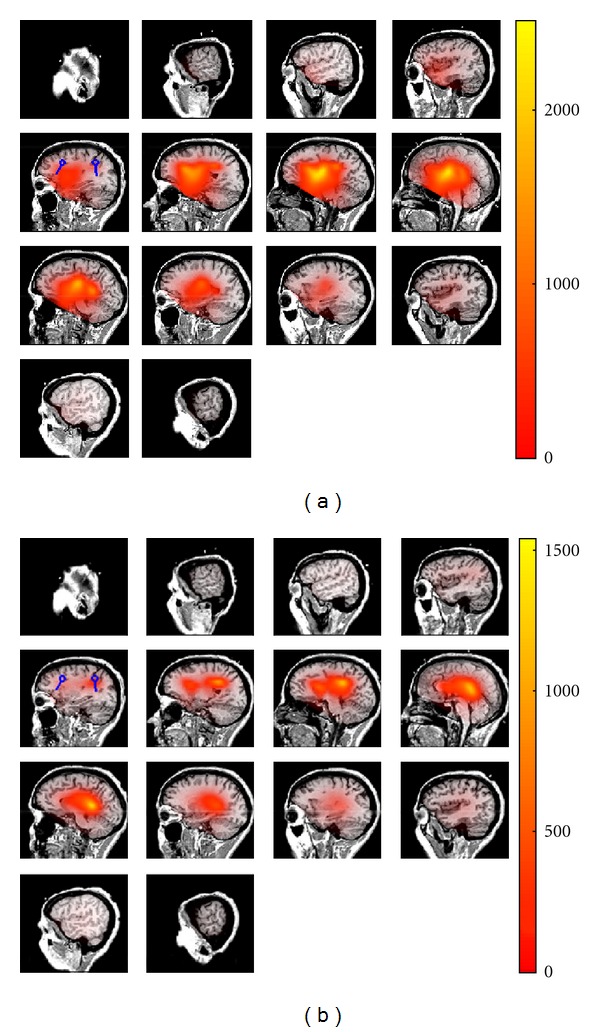
Figure 2.

Estimated locations of the sources using RAP-MUSIC based on the real part of cross-spectrum. True locations of the sources are shown as blue dipoles and the estimated locations are shown using the heat map. (a) represents the sources after applying the first iteration of RAP-MUSIC and (b) shows the source location after projecting out the global maximum of (1) in the previous iteration.
