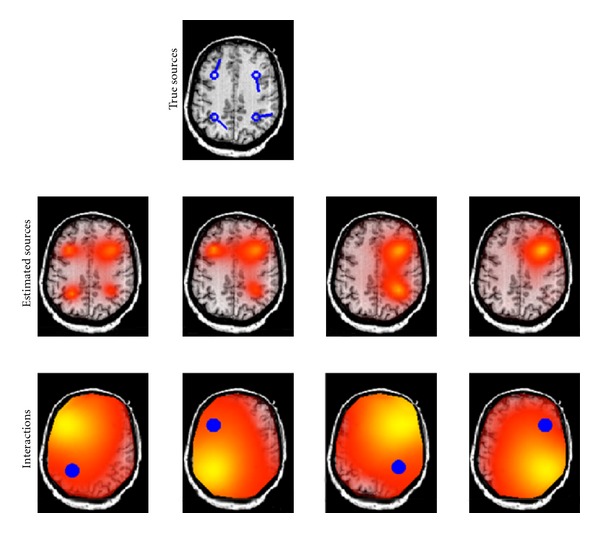
Figure 4.

Four interacting dipoles are simulated. Each two sources in one hemisphere are interacting with each other. In the top figure, the location of true sources are shown. In the middle row, estimated source locations using RAP-MUSIC based on the imaginary part of cross-spectrum are demonstrated and in the bottom row the area which is interacting with each of the corresponding sources (visualized as blue dots) is demonstrated.
