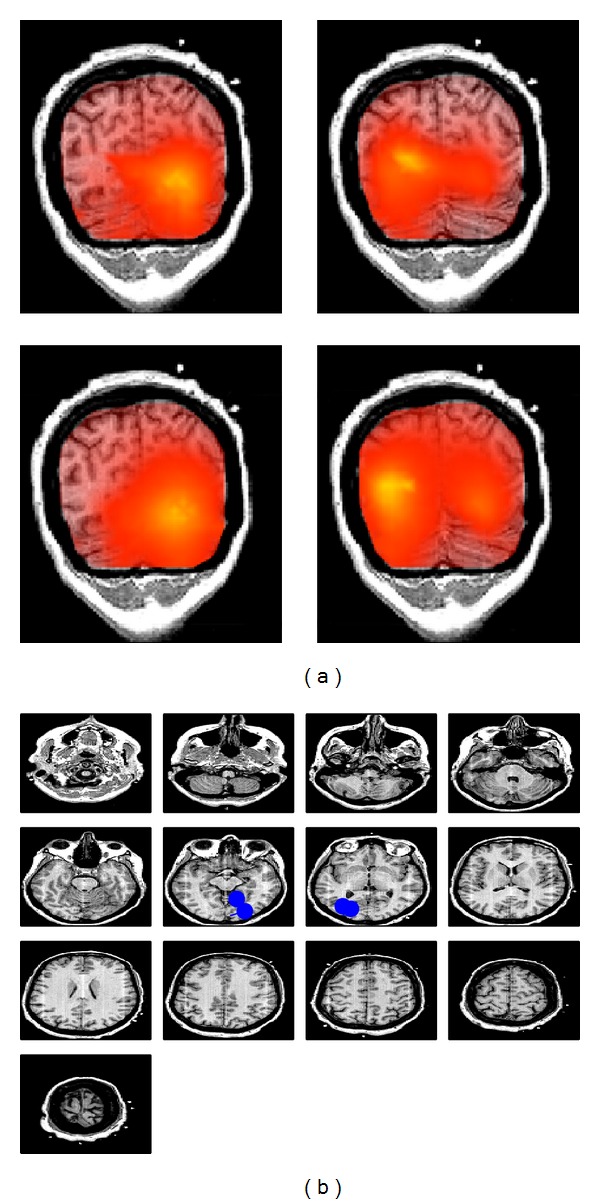
Figure 5.

(a) RAP-MUSIC applied to the real data to localize 4 interacting sources. Each panel in (a) represents an iteration in RAP-MUSIC starting from the top left panel, then top right and so forth (b) The blue dipoles represent the final estimated source locations after all iterations.
