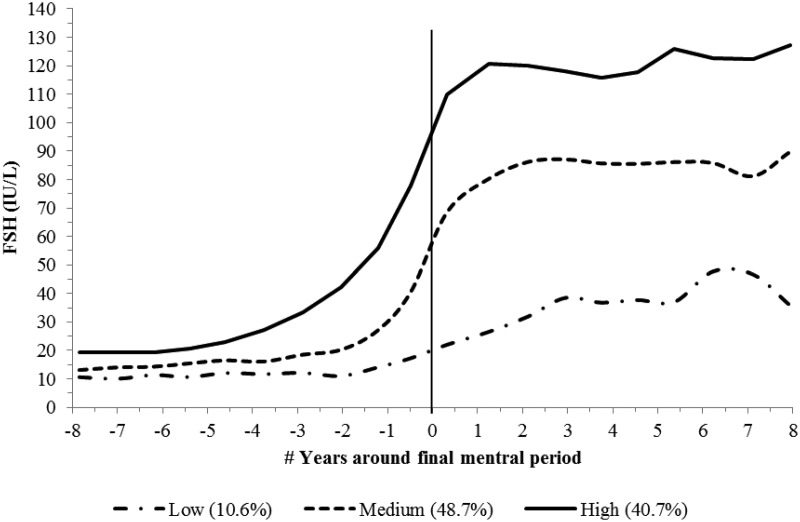
Fig. 3.
Trajectory of FSH across the FMP. Significant predictors for trajectory separation were race/ethnicity and BMI (see Supplemental Table 3 for modeling details). FSH levels were the average observed serum FSH levels at each time point. Time-varying age and cycle day of blood draw were adjusted in the model. The model accuracy diagnostics showed that the capacity of the model to separate women among the groups was very good. The AvePP ranged from 0.87 to 0.92 and the OCC ranged from 7.00 to 105.51.

