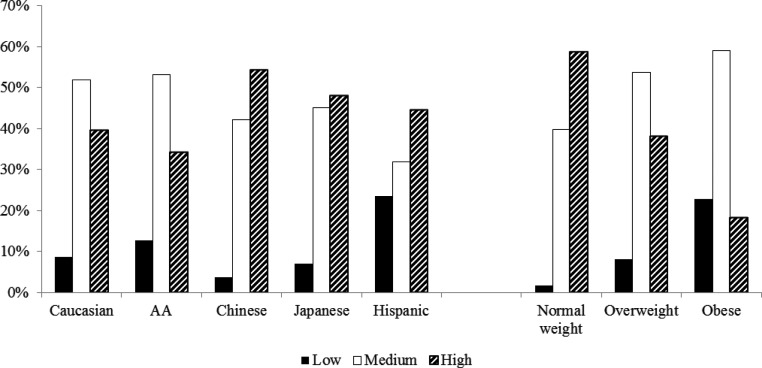
Fig. 4.
Distribution of FSH trajectory subgroups by race/ethnicity and BMI. BMI was analyzed as normal weight (<25 kg/m2), overweight (25–29.9 kg/m2), and obese (≥30 kg/m2). Percentages represented the percent of FSH trajectory subgroups within each race/ethnicity or BMI category. The total percentage within each race/ethnicity or BMI category was 100%. Overall P values based on χ2 tests for the distribution of FSH trajectory subgroups by race/ethnicity and BMI were both less than 0.0001.

