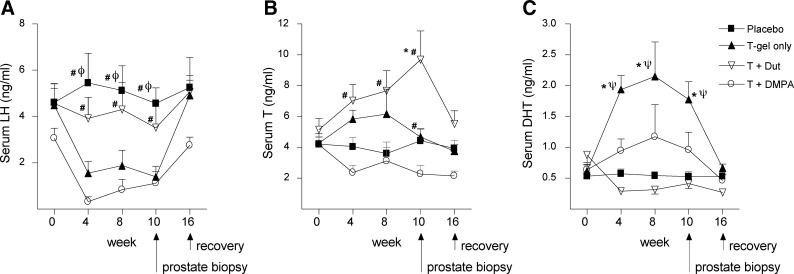
Fig. 1.
Serum LH and androgen concentrations in healthy men treated with placebo (black squares), T gel (black triangles), T gel + DMPA (white circles), or T gel + dutasteride (T + Dut; white triangles). Values shown at each time point are medians ± se. *, P < 0.05 vs. placebo; φ, P < 0.05 vs. T gel; ψ, P < 0.05 vs. T gel + dutasteride; #, P < 0.05 vs. T+DMPA. Serum LH (A) was measured by immunofluorometric assay, and serum T (B) and DHT (C) were measured by mass spectrometry in samples obtained during 10 wk of treatment and a 6-wk washout period.

