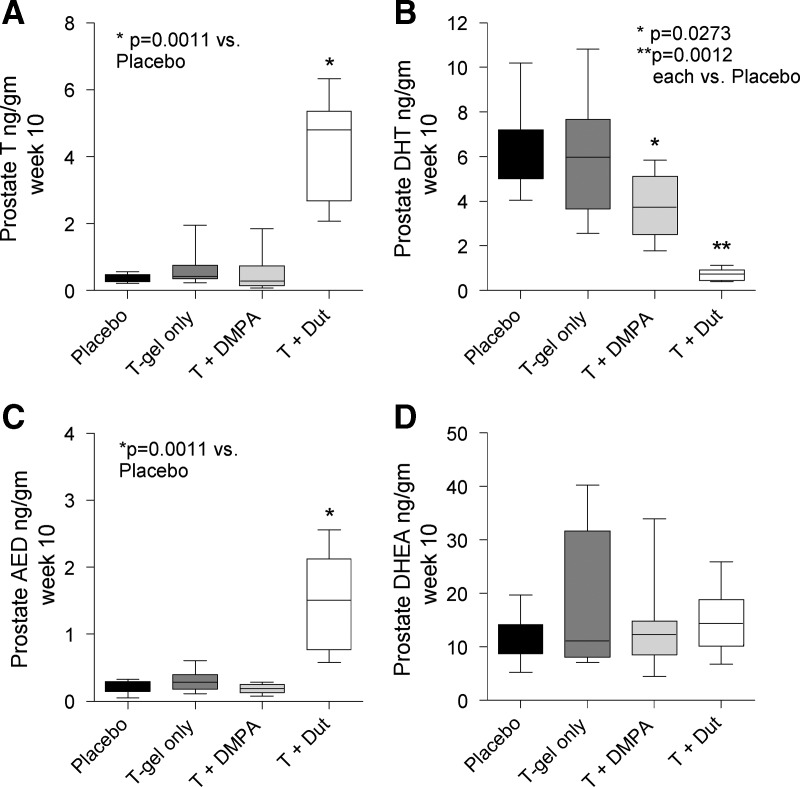
Fig. 2.
Box and whiskers plots of prostate androgen concentrations in healthy men treated with placebo (black columns), T gel (dark gray columns), T gel + DMPA (light gray columns), or T gel + dutasteride (white columns). Intraprostatic T (A), DHT (B), AED (C), and DHEA (D) were measured by mass spectrometry in prostate biopsies obtained at the 10-wk time point of treatment.

