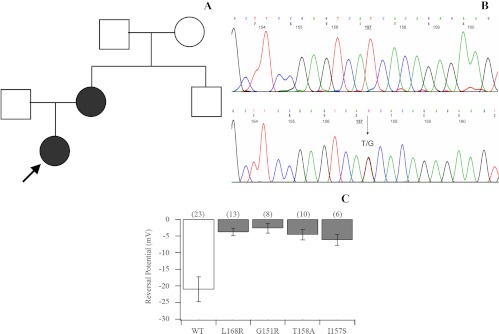
Fig. 1.
A, Kindred structure of the affected family. Affected members are shown as filled symbols. The arrow indicates the index case. B, Part of the sequencing chromatogram of exon 2 of the KCNJ5 gene in a normal subject (upper panel) and the patients carrying the heterozygous T-to-G transition n.G470T (lower panel). C, KCNJ5 mutations result in the depolarization of current reversal potential. Reversal potentials are plotted for wild-type (WT) Kir3.4 (KCNJ5)/Kir3.1 (KCNJ3) channels and each Kir3.4 (KCNJ5) mutant/Kir3.1 (KCNJ3). WT channels (white bar) show a negative reversal potential. Mutant channels (gray bars) show less negative reversal potentials (P < 0.05 in each case), suggesting a loss of ion selectivity. Numbers in parentheses are the number of cells recorded.

